What happens when the Wi-Fi drops during a client call, and nobody notices until a customer complains? For most small businesses, that is exactly the problem. There is no network operations center, no night shift, and often no dedicated IT person. Someone just has to know when a router, switch, or server misbehaves before it costs money.
That is the job of network monitoring software. The trouble is that the market is crowded with tools built for enterprises, priced for enterprises, and documented for people who already know what SNMP means. This guide cuts through that. It explains what small teams actually need, which categories of tools fit which situations, and where the hidden costs and frustrations usually show up.
Why small businesses need monitoring at all
A small office network is not simple anymore. A typical setup includes a firewall, a couple of switches, a wireless access point or three, a NAS box, a few cloud services, and maybe a point-of-sale system. Any one of those can fail quietly. A switch port flapping at 40 percent packet loss does not announce itself. It just makes everything feel slow, and staff blame the internet provider.
Monitoring replaces guesswork with data. A monitoring tool does a few things: it checks whether devices are reachable, reads health counters from them, collects logs, and sends an alert when a metric crosses a threshold. The baseline test is ICMP ping, which only tells you a host is up. Add TCP port checks and HTTP status checks, and you catch application outages that ping misses entirely. For switches, routers, and servers, the standard is SNMP, the Simple Network Management Protocol first defined in RFC 1157 in 1990 and later hardened with authentication and encryption in the SNMPv3 document set.
The practical lesson: a tool that only pings is a smoke detector. A tool that reads SNMP counters and checks services is a real early-warning system.
The four things that actually matter when choosing
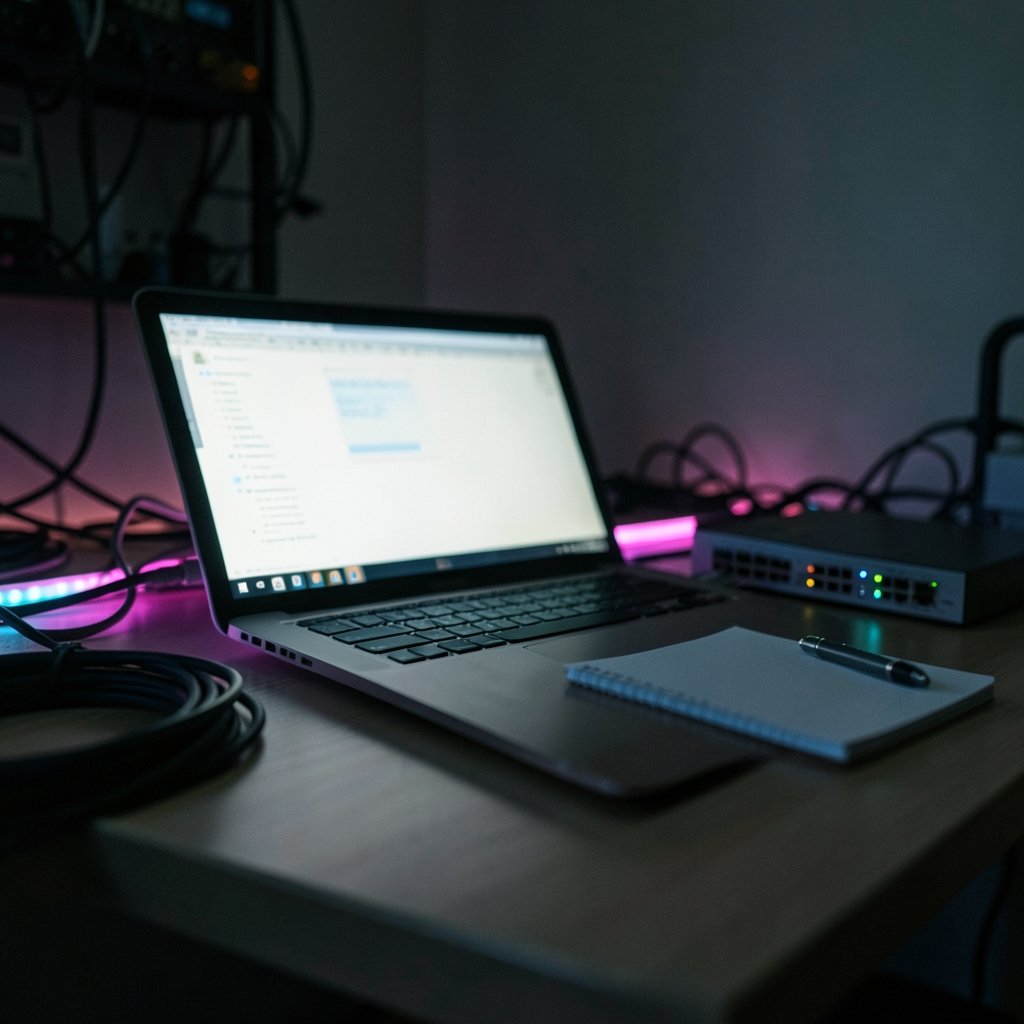
Vendor comparisons rarely agree, and most “best of” lists are commercial. A more defensible approach is to judge every tool on four criteria.
Protocol coverage. Does it support SNMP, ICMP, TCP/UDP ports, and syslog? Syslog, standardised in RFC 5424, is how firewalls and switches send their logs to a central place. If a tool cannot collect syslog, you will still be reading device logs one box at a time. Flow data via NetFlow or IPFIX, standardised as RFC 7011 in 2013, shows who talked to whom, which is useful but rarely essential for a ten-person office.
Deployment model. On-premises tools give you full control and no subscription. SaaS tools give you a dashboard you can check from a phone and no server to maintain. Small teams with no server room often do better with SaaS; teams with a spare virtual machine often prefer self-hosted.
Alerting quality. This is where most tools fail in practice. Too many low-value alerts train people to ignore the dashboard, a risk the Google SRE Book discusses at length in its chapter on monitoring distributed systems. A tool that sends 200 emails a day is worse than no tool. Look for alert grouping, maintenance windows, and easy threshold tuning.
Total cost, including your time. Licence fees are only part of it. Add the hours spent installing, patching, and tuning. A free tool that eats a weekend every quarter is not free.
A realistic comparison of the main options
The table below groups tools by the kind of small business they suit. Prices and editions change constantly, so treat the cost column as a shape, not a quote.
| Tool | Model | Best for | Strengths | Watch out for |
|---|---|---|---|---|
| Zabbix | Open source, self-hosted | Teams with a Linux-savvy admin | Deep SNMP coverage, templates for thousands of devices, free core | Setup is technical; the interface assumes you know monitoring concepts |
| Nagios Core | Open source, self-hosted | Classic up/down and service checks | Mature, huge plugin ecosystem, very light | Configuration is file-based and fiddly; dashboards feel dated |
| Prometheus plus Grafana | Open source, self-hosted | Teams already running modern apps | Excellent metrics and graphing, strong community | Pull model and PromQL have a learning curve; SNMP needs an exporter |
| PRTG | Commercial, on-prem or hosted | Offices that want it working on day one | Auto-discovery, clean interface, free tier for small sensor counts | Cost scales with sensor count, which creeps up fast |
| Datadog and similar SaaS | Commercial SaaS | Cloud-heavy stacks and remote teams | Fast setup, strong alerting and dashboards | Per-host pricing gets steep; network hardware support is thinner |
| Auvik and similar MSP tools | Commercial SaaS | Businesses using an IT provider | Automatic network mapping, minimal setup | Built around managed service providers; pricing reflects that |
For a five-person office with one switch and a firewall, the honest answer is often a lightweight SaaS tool or the free tier of a commercial product. For a 40-person business with a server room and a part-time IT person, Zabbix or Prometheus repay the setup effort many times over. If the business already leans on cloud infrastructure, it is worth reading up on what virtual machines really cost before adding another hosted service to the bill, since monitoring spend should be judged alongside the rest of the stack. Practical breakdowns of Azure virtual machine costs for small projects and businesses and Amazon EC2 costs for small projects on a realistic budget help frame that comparison honestly.
Open source versus paid: the trade nobody mentions
The open-source argument sounds simple. Zabbix, Nagios, and Prometheus cost nothing, so they must be cheaper. In practice, the trade is money for time.
A self-hosted stack needs a machine to run on, someone to install it, someone to patch it, and someone to build dashboards. None of that is hard for an IT generalist, but it is real work. The failure mode is common: a business installs Zabbix in a burst of enthusiasm, configures twenty hosts, then stops tuning it. Six months later the alerts are noise and the dashboard is stale.
Paid tools flip the trade. You pay monthly, but discovery is automatic and the interface is designed for people who are not monitoring specialists. The failure mode here is different: sensor-based pricing quietly grows as you add devices, and the renewal invoice surprises someone.
The practical rule that works: pick open source when you have someone who genuinely enjoys this work, and pick paid when you do not. Both are legitimate. Pretending the free option is free is where small teams get burned.
Practical tips that save real headaches
Start with five checks, not fifty. Monitor the firewall, the core switch, the Wi-Fi controller, the main server, and the internet uplink. Add more only when those five are stable and the alerts are trustworthy.
Set thresholds from a week of baseline data. A CPU alert at 80 percent sounds sensible until you learn the backup job hits 85 percent every night at 2 a.m. Watch first, then set limits.
Use maintenance windows religiously. Every planned reboot should suppress alerts automatically. If your tool cannot do this easily, that is a reason to reject it.
Route alerts to one place. Email, chat, or SMS, but pick one. Alerts split across three channels get missed in all three.
Monitor the things customers feel. Uptime on the public website, response time on the booking system, and reachability of the payment terminal matter more than switch fan speed.
Write down what “healthy” means. Without an agreed target, such as 99.9 percent monthly availability, monitoring data cannot become a service-level objective. The SRE Book’s treatment of SLIs, SLOs, and SLAs is worth an hour of anyone’s time, and it applies to a ten-person business just as much as to a hyperscaler.
Check your logging obligations. In the EU, the GDPR governs processing of personal data, and logs containing IP addresses can fall inside that scope. Retention periods and access rules should be decided before centralising logs, not after. The legal position on IP addresses varies by jurisdiction, so check locally rather than assuming.
Common mistakes that undermine monitoring
The first mistake is buying features instead of outcomes. A tool with forty integrations is useless if nobody reads its alerts. The second is monitoring only uptime. Ping tells you a device answers; it does not tell you the disk is full or the certificate expires on Friday. The third is skipping documentation. When the person who set up the monitoring leaves, an undocumented setup becomes a black box that nobody dares touch.
The fourth mistake is more subtle: treating monitoring as an IT project rather than a business one. The owner cares about the till working and the website loading. Frame alerts around those outcomes and the monitoring programme survives budget season.
Where AI tools fit, and where they do not
A growing number of monitoring products advertise AI-driven anomaly detection. The promise is appealing: no thresholds to tune, just let the model learn what normal looks like. In practice, these features work best as a second layer on top of solid basic checks. They are poor substitutes for them, because a model cannot tell you a port is down if nobody configured the port check.
Small teams exploring automation more broadly will find useful context in this roundup of the best AI automation tools for small businesses, which covers how these tools behave in real deployments rather than in demos. The same caution applies: automation amplifies whatever process you already have, including a bad one.
It is also worth remembering that monitoring is one piece of a wider toolkit. Teams building internal dashboards or reporting on uptime often pair monitoring data with presentation software; a comparison of AI presentation tools for small businesses that save real time is helpful when the monthly service report has to go to a non-technical audience. And if the monitoring project involves scripting custom checks or building a small status page, the practical notes in this guide to AI coding assistants for small businesses in 2026 can shorten the learning curve without replacing real understanding.
Conclusion
There is no single best network monitoring tool for small businesses, and anyone who claims otherwise is probably selling something. What exists is a good fit for your situation. A tiny office with no IT staff should look at a hosted tool with automatic discovery and a free or cheap starting tier. A mid-sized business with a technical generalist on staff should seriously consider Zabbix or Prometheus, accepting the setup cost in exchange for control and no per-sensor billing. A business that outsources IT should ask its provider what they already run, because duplicating it wastes money.
Whichever path you take, the fundamentals do not change. Cover SNMP, ping, port checks, and syslog. Tune alerts until people trust them. Set thresholds from real baseline data. Document everything. Do those four things and even a modest tool will outperform an expensive one that nobody tuned.
Frequently asked questions
What is the best free network monitoring tool for a very small business?
For most very small businesses, Zabbix is the strongest free option if someone can handle a Linux install, because its SNMP templates cover a huge range of switches and routers. Nagios Core is lighter but more fiddly to configure. If nobody on staff is technical, the free tier of a commercial hosted tool is usually a better practical choice than a free tool that never gets properly set up.
Do I need SNMP, or is ping enough?
Ping is not enough on its own. It confirms a device is reachable but says nothing about CPU load, disk space, interface errors, or whether a service is actually responding. SNMP reads those health counters from switches, routers, and servers, while TCP and HTTP checks catch application-level failures. A useful setup combines all three.
How many devices should a small business monitor?
Start with the devices whose failure would be noticed by customers or staff within an hour: the internet uplink, the firewall, the core switch, the wireless controller, and any server running a business-critical application. That is usually five to ten checks. Expand only after those alerts are reliable and people actually respond to them.
How much does network monitoring cost for a small business?
Costs range from nothing for self-hosted open source, plus the server and staff time to run it, to monthly subscriptions that scale with the number of devices or sensors monitored. The subscription figure is rarely the whole story. Budget for the hours spent installing, tuning, and maintaining the tool, because that is where small teams most often underestimate.
Can monitoring tools alert me on my phone?
Yes. Most modern tools support email, chat integrations, SMS, and push notifications to a mobile app. The important discipline is to route alerts to one primary channel and keep the volume low enough that people act on them. Alerts spread across several channels tend to get ignored in all of them.
Is cloud-based monitoring better than running it on-premises?
Neither is universally better. Cloud-based tools need no server, are reachable from anywhere, and usually set up faster, which suits teams without dedicated IT. On-premises tools give full control over data and avoid recurring fees, which suits businesses with a server room and a technical person. The deciding factor is who will maintain it, not which model sounds more modern.