
Apple’s share quote is most useful when you know when it was recorded and what the surrounding market figures measure. For U.S. investors following Apple shares and daily market trends, a quote gives a snapshot of trading at a specific time. It does not promise a future result.
The same price can mean different things during active trading, after the market closes, or before the next session opens. A page may show a delayed quote, a live quote, or the last completed trade. Those details matter when you compare prices or check daily changes.
This page puts the quote in context with trading activity, historical prices, company results, and market expectations. It is designed for U.S. investors who want to read the data clearly, not treat a single figure as a forecast. Every stock quote needs a date and trading status. Check the quote timestamp before comparing it with another day’s price.
Key Takeaways
- A share quote records a price at a particular time.
- Daily change compares the latest price with the prior close.
- Trading volume shows how many shares changed hands.
- Historical charts may use split-adjusted prices.
- Analyst targets are estimates with stated time horizons.
- Company results and market conditions can shape expectations.
What Is the Price of Apple Stock Today?
On Oct. 28, 2026, one Apple share was quoted at $344.28, down $2.82 from the previous close. The dated quote gives the latest recorded price for that market update, not a promise of the next trade.
The price and daily change describe one trading date. Apple Inc. shares traded under AAPL, and the previous close was $347.10. The selling price of Apple stock today means the executable market quote when an order fills. A page’s displayed price may differ from the final sale price.
| Measure | Oct. 28, 2026 value | Quote context |
|---|---|---|
| Last price | $344.28 | USD per share |
| Daily change | -$2.82 (-0.81%) | Versus $347.10 previous close |
| Market capitalization | $5.024 trillion | Company market value |
A displayed price is a snapshot, while the final execution price depends on the quote when the order fills.
Market capitalization is the total market value of a company’s outstanding shares, calculated by multiplying the share price by the number of outstanding shares. It gives a broad measure of the market value assigned to the company’s equity.
A stock price is quoted in dollars per share, while market cap sums the value of all outstanding shares. These figures answer different questions. One describes a share; the other describes the company’s total market value.
Trading status also matters. A quote marked as the last close is not the same as an active quote during market hours. Prices can change as orders meet, so a displayed figure may not match the price available seconds later.
Treat the quote as a dated snapshot and confirm the live price before placing an order.
What Do Today’s Trading Volume and Beta Show?
Apple traded about 16.8 million shares on Oct. 28, below its average daily volume of about 43.7 million shares. Volume counts shares traded during a period, while beta compares past price movement with the broader market.
Neither measure predicts the next move. Apple’s 5-year monthly beta was 1.07 on Oct. 28, 2026. Beta is a historical comparison, not a forecast or a guarantee of future volatility.
- Current volume: 16,818,299 shares traded on Oct. 28, 2026.
- Average volume: 43,698,979 shares per day on Oct. 28, 2026.
- Beta: 1.07 for five-year monthly price movement relative to the broader market.
The day’s volume was well below the stated average. A single session can have more or fewer trades than usual for many reasons, and the number alone does not explain why.
Beta offers a different kind of context. A beta above 1 means the stock moved more than the benchmark on average in the measured period. A reading below 1 means it moved less, based on that same historical comparison.
Beta does not say what will happen in the coming week. It also does not capture every risk tied to a company, its products, or its finances. The measure summarizes a past relationship with the market.
Read one day’s volume alongside a longer period rather than treating it as a stand-alone signal.
Where Is Apple in Its 52-Week Range?
Apple’s Oct. 28 range of $343.90-$347.18 sat near the upper end of its $243.42-$351.73 range for the prior 52 weeks. The 52-week band tracks a rolling year’s high and low, not a price forecast.
The daily range and annual range measure different spans. The daily range shows the low and high during Oct. 28 trading. The 52-week range covers the trailing year through that date.

The 52-week low was $243.42 on Jan. 20, 2026. The high was $351.73 on Oct. 23, 2026. Those dates show how recently the two endpoints occurred without turning the range into a forecast.
The Oct. 28 share price was close to the range’s upper end, but a high-low band does not explain the reasons for earlier moves. It also cannot tell you where the stock will trade next week or next year.
Investors comparing stocks can use a similar period for each one. A daily range should not be compared with an annual range, since the time windows differ.
Price charts may also show a closing price, an intraday high, or a quote captured during trading. Each measure can produce a different comparison, even on the same date.
Compare the same type of measurement, such as daily close to daily close, when judging movement over time.
How Has Apple Stock Performed Over Time?
Apple’s 2022 annual share-price performance was -28.20%, a reminder that a long-term chart can include substantial declines. A chart’s meaning depends on its time window and how it treats share splits.
A single quote and an annual return are not the same measure. The price graph for Apple stock today is easier to interpret when you choose a time window and check whether prices are adjusted for splits.
What the 2022 decline looked like
Apple stock price in 2022 fell 28.20% for the year. The monthly prices below are points in time, not the calculation of that annual return.
| Month | Monthly real share price | Historical context |
|---|---|---|
| January 2022 | $174.78 | Start of the 2022 comparison |
| December 2022 | $129.93 | End of the 2022 comparison |
| December 2025 | $271.86 | Year-end reference |
| October 2026 | $344.70 | Latest monthly reference |
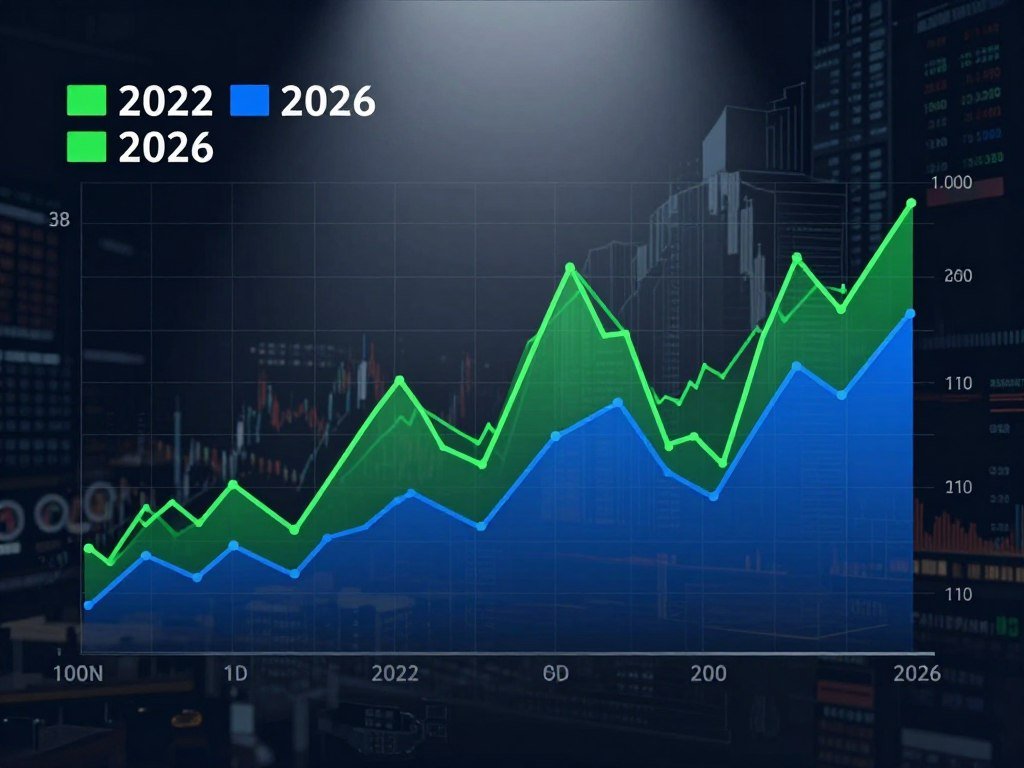
How the recent monthly prices compare
The monthly figures show prices at selected points, rather than every day’s movement. January and December 2022 frame that year’s comparison, while the later values provide year-end and recent monthly references.
A chart can use raw prices from the time or restate earlier prices to account for stock splits. That choice changes how older per-share prices appear beside newer ones. It does not change the historical return when the same adjustment method is applied consistently.
Long charts can also hide short periods of sharp movement. A monthly view may smooth out daily swings, while a daily chart can make small changes look more dramatic.
Check that the chart uses matching price settings and dates before comparing separate periods. Otherwise, an apparent difference may reflect the chart’s scale rather than a change in the underlying business.
Match the chart’s adjustment setting and date interval before comparing two prices.
What Are Apple’s Highest and Lowest Stock Prices?
Apple’s highest end-of-day share price through October 2026 was $348.22 on Oct. 22, 2026. The record close means the price at the end of that trading day, not the highest intraday trade.
The lowest historical end-of-day price shown, adjusted for splits, was $0.03768 on July 8, 1982. The two records use different historical contexts, so they need careful comparison.

The record high is a closing figure. A share may trade above its closing price during a session, so an intraday high is a separate measure.
The historical low is a split-adjusted price. Adjusting for splits restates earlier per-share prices to account for changes in the number of shares. A split-adjusted figure is not the same as the price paid in an unadjusted trade at that time.
These distinctions matter when a record is described as the “highest” or “lowest” price. The claim may refer to a close, an intraday trade, or a series adjusted for later stock splits.
Apple’s stock record is also tied to the dates used in the price series. As more trading days pass, a record “through October 2026” applies only to the history up to that point.
Check whether a claimed record refers to a closing price, an intraday price, or a split-adjusted series.
How Do Apple’s Stock Splits Affect Historical Prices?
A stock split increases the number of shares and lowers the per-share price proportionally, without changing the holding’s total value at that moment. The key change is the share count, not the owner’s total stake.
A split changes per-share math, not the company’s value by itself. Apple stock price history without splits shows the per-share prices as traded at the time. Split-adjusted charts restate older prices to make comparisons with today’s share count more consistent.
What a stock split changes
For example, in a 2-for-1 split, each share becomes two shares, and the price per share is cut in half. The total value of the holding stays the same at the moment of the split, before any market movement.
Apple’s five stock splits were:
- 2-for-1 on June 16, 1987.
- 2-for-1 on June 21, 2000.
- 2-for-1 on Feb. 28, 2005.
- 7-for-1 on June 9, 2014.
- 4-for-1 on Aug. 31, 2020.
Apple completed its 4-for-1 split on Aug. 31, 2020, and adjusted shares began trading that day. A chart that adjusts older prices applies split math across the earlier record.
Why adjusted charts look different
An unadjusted chart preserves historical per-share prices as they traded at the time. It can help you see the nominal price faced by buyers then, but it does not put every date on today’s share-count basis.
A split-adjusted chart changes the displayed historical prices to make the share count more comparable across dates. It does not mean investors paid those adjusted prices in the past.
As of 2026, Apple had not announced another stock split. A split announcement is a separate company action, and it cannot be inferred from a rising share price.
Check the chart’s split-adjustment setting before comparing an old per-share price with today’s quote.
What Do Apple’s Latest Earnings Reveal?
Apple reported $109.42 billion in fiscal third-quarter 2026 revenue and $29.79 billion in earnings. The fiscal quarter covers a set reporting period, while trailing 12-month totals combine the year leading up to October 2026.
Keep the quarter and trailing-year figures separate. Apple’s fiscal third-quarter 2026 profit margin was 27.23%, a measure of profit relative to revenue.
Fiscal third-quarter 2026 results
Revenue is the money a company brings in from its sales and services before expenses. Earnings describe profit after expenses under the stated reporting measure. Looking at both helps show the difference between business activity and what remains as profit.
Profit margin is the share of revenue remaining as profit using the stated earnings measure. A 27.23% margin means profit equaled that share of revenue for the fiscal quarter.
A quarter can be affected by timing, customer demand, product mix, and costs. The reported figures alone do not show which factor caused a share-price move on a particular day.
Trailing 12-month revenue and income
For the 12 months through October 2026, Apple reported $466.82 billion in revenue. Net income available to common shareholders was $128.93 billion over that same trailing period.
Those totals cover a longer window than the fiscal third quarter. They offer a wider view of recent business activity, but they still describe past results rather than future performance.
An earnings report can also include management discussion and details about individual business areas. Readers can compare those points with earlier periods, while keeping the reporting dates aligned.
One quarterly earnings report is a snapshot. It cannot, by itself, establish why the share price changed or what the next period will bring.
Compare revenue, earnings, and margin over the same reporting period when assessing business performance.
How Does Apple Make Money Across Its Products and Services?
Apple sells a connected range of devices, from iPhone and Mac to iPad, wearables, and home products. The product mix spans smartphones, personal computers, tablets, wearables, and accessories.
Hardware and services are distinct parts of the company’s business. Apple was founded in 1976 and is headquartered in Cupertino, California.
Hardware categories in Apple’s ecosystem
The iPhone is Apple’s smartphone line. Mac covers personal computers, including familiar models such as MacBook Pro. iPad is the company’s tablet category.
Wearables include Apple Watch and AirPods. Home and accessory products include Apple TV, Beats products, HomePod, and Apple Vision Pro. Each category serves a different use, even when devices work together.
iPhone camera choices can vary by model, size, and budget, which may shape what shoppers value in a phone. Product preferences do not, by themselves, establish the company’s future sales.
Services that extend the customer relationship
Apple’s services include AppleCare, cloud services, the App Store, Apple Pay, and Apple Music. They add support, online storage, digital content, and payment features around the company’s devices.
Services can connect with hardware use in different ways. AppleCare covers support and service options, while cloud services help users access information across devices. The App Store and Apple Music offer digital content and apps.
Apple Pay provides payment services within the company’s product environment. The mix also includes subscription and transaction activity, rather than only sales of physical products.
A MacBook Pro is one example of the Mac category, not a separate measure of Apple’s business. Device sales and service activity can respond to different customer needs and business conditions.
Keep product demand and service activity distinct when considering the different parts of Apple’s business.
What Are Analysts Forecasting for Apple Stock?
The October 2026 average 12-month analyst target was $340.59, below the Oct. 28 quote of $344.28. That target reflects an average estimate, not a promised future price.
The October 2026 target range ran from $245.00 to $400.00 per share. MarketBeat compiled the average from 43 Wall Street analysts.
How the 12-month target range compares
| Forecast point | Price per share | Period |
|---|---|---|
| Low | $245.00 | 12 months |
| Average | $340.59 | 12 months |
| High | $400.00 | 12 months |
A price prediction for Apple stock today is a snapshot of expectations, not a guaranteed closing price. MarketBeat’s October 2026 consensus rating was Moderate Buy, with predicted downside of 1.06% based on 12-month forecasts.
Analyst rating labels can vary by firm and method. MarketBeat’s guide to analyst ratings explains how terms such as buy, hold, and sell summarize opinions rather than assure results.
What the ratings mix does and does not say
The October 2026 ratings included 25 buy, 15 hold, 2 sell, and 1 strong buy among 43 analysts. The totals describe analyst views at that time, not a vote that determines the share price.
MoffettNathanson maintained a Neutral rating on Oct. 20, 2026, and lowered its target from $304 to $283. That differs from the broader consensus and shows how analysts can reach different views.
A rating or target can change when an analyst revises assumptions about earnings, growth, or market conditions. It does not make the estimate a company commitment.
Can anyone estimate Apple’s share price in 2030?
The 12-month range cannot establish Apple’s share price in 2030. Any 2030 scenario depends on future revenue, margins, and valuation, each of which may change over time.
Long-range projections require assumptions about years of business results. Small changes in those assumptions can lead to very different estimates, so a distant price figure has wide uncertainty.
A market outlook can also shift before its stated horizon ends. Tesla merger coverage offers another example of separating analyst expectations from confirmed company action in a reported merger timeline.
Treat every target as a dated estimate with an explicit time horizon.
How Should Investors Read Apple’s Valuation and Dividend?
Apple’s trailing P/E was 39.48 on Oct. 28, 2026, alongside diluted EPS of $8.72. The ratio compares the share price with earnings per share from the prior 12 months.
A P/E ratio describes a price-to-earnings relationship, not an automatic value judgment. It does not prove that a stock is cheap or expensive on its own.
What the trailing P/E and EPS measure
Trailing P/E means share price divided by earnings per share from the prior 12 months. EPS, or earnings per share, divides company earnings across shares under the reported measure.
A trailing P/E of 39.48 describes what investors were paying relative to past earnings on Oct. 28, 2026. The ratio can change when the share price moves or earnings change.
One company’s P/E is easier to read beside its own history or a relevant comparison. Differences in growth expectations, business mix, and reporting periods can affect what the number means.
How to interpret the forward dividend yield
Apple’s forward dividend was $1.08 per share, with a 0.31% yield on Oct. 28, 2026. The forward dividend is an annual per-share amount, while yield compares that amount with the current share price.
A low yield means the dividend forms a smaller part of the current share price. Yield can change as the share price changes, even if the annual dividend amount stays the same.
The dividend is only one way to describe a stock’s income profile. It does not capture possible changes in share price or the company’s future results.
Compare valuation measures with the same date and earnings period before drawing a conclusion.
What Could Move Apple Stock After Today’s Quote?
Apple’s Oct. 2026 balance sheet showed $62.4 billion in cash and a total debt-to-equity ratio of 78.44%. Those figures describe different parts of its financial position.
Cash, debt-to-equity, and return on equity measure separate things. Return on equity was 148.75% for the 12 months reported in October 2026, a profitability measure tied to shareholder equity.
Earnings and financial capacity
The next earnings report date was listed as Nov. 2, 2026. That date is a calendar item for investors tracking results, not a guarantee of a particular market reaction.
The next earnings report can offer new details about demand, margins, and management’s forward expectations. Those details may differ from earlier assumptions, so the report can affect how investors view the business.
Cash shows funds held by the company. Debt-to-equity compares debt with shareholder equity, while return on equity measures earnings against that equity. These figures answer different questions and should not be treated as interchangeable.
Product demand and execution
Product demand can change with customer interest, pricing, and the quality of the experience. Product execution matters too: early display complaints were associated with the $2,000 iPhone Duo.
Those complaints are an example of execution risk, not proof of customer demand or future sales. A product issue may affect customer confidence, but its business impact depends on how widespread and lasting it is.
Apple’s broader device platform also shapes expectations about products and services. The company’s work in artificial intelligence may relate to its existing devices, though Apple is not a pure-play AI business. Investors can compare that theme with other AI-related stocks and business models.
For Mac buyers, accessory fit can matter to daily use. A guide to USB-C hubs for MacBook Pro covers ports and display needs, a practical example of how product details shape use.
- Reported results and changes in forward expectations.
- Shifts in demand across Apple’s products.
- Customer reports about product reliability.
- Trends in cash and debt.
A product headline is one piece of information, not proof of how the stock will respond.
Check the company’s reported results against expectations rather than assuming a product headline determines the share price.
How Can You Track AAPL and Make a Buying Decision?
AAPL is Apple’s Nasdaq ticker, while the S&P 500 can provide a broad-market comparison for tracking performance. The benchmark offers context about the wider market, not a verdict on whether a stock fits your plan.
Use a personal checklist to connect market data with your own goals. The S&P 500 is a broad-market benchmark used to contextualize stock-market performance.
- Set an investment time horizon before making a decision.
- Consider how much company-specific exposure you already have in your portfolio.
- Decide in advance whether to use a market order or a limit order.
- Revisit your original reason for holding the shares as new reports arrive.
Comparing AAPL with the S&P 500 can show whether its performance has differed from the broad market over the same period. That comparison provides context, but it does not determine suitability for your portfolio.
A market order seeks execution at the best available price, which can change while the order is processed. A limit order sets a price boundary, but it may not execute if the market does not reach that price.
Your time horizon can shape how you view short-term changes. Company-specific exposure also matters because a portfolio already tied closely to one business may carry concentrated risk.
New reports can change the facts behind an investment decision. Revisiting the original reason for holding shares helps you judge whether that reason still fits your goals.
Make the decision against your own time horizon and risk tolerance, not a single day’s quote.
Conclusion
A useful view of Apple starts with the date and context behind the quoted price. A share price is a time-specific market measure, while an analyst target is an estimate tied to a stated horizon.
Market figures make more sense when you know what they measure and which period they cover. A daily quote, company result, and forecast answer different questions, so avoid treating them as interchangeable.
Before making a trade, confirm the live quote and compare the decision with your own investment plan.
FAQ
What is the current face value of Apple stock?
Apple common stock has a par value, sometimes called face value, of $0.00001 per share. That legal accounting amount is different from the market price, which changes as shares trade. Par value does not tell you what a share could sell for or what the company is worth. Investors usually see market prices quoted in dollars per share.
Why is Apple stock AAPL and not Apple?
AAPL is the ticker symbol that identifies Apple shares on Nasdaq. It is a trading symbol, not an abbreviation that spells out the company’s name. Tickers help distinguish companies and their listed securities in market data, order screens, and financial reports. Apple remains the company name, while AAPL labels its shares in trading systems.
Will Apple split in 2026?
Apple had not announced another stock split as of 2026. A split changes the number of shares and the per-share price in proportion, but it does not change the total value of a holding at that moment. A later market move can change the holding’s value. The past pattern of splits does not establish that another one will happen.
How much are $1,000 shares of Apple stock worth today?
If you mean 1,000 shares, they would be worth $344,280 at $344.28 each on Oct. 28, 2026, before fees and taxes. If you mean a $1,000 investment, that is a different calculation because it refers to a dollar amount, not a share count. The value of either position can change as the market price moves.
Is it a good idea to buy Apple stock right now?
There is no one-size-fits-all buy decision for Apple stock. Consider your time horizon and risk tolerance alongside the dated quote, business results, valuation, and how much company-specific exposure your portfolio already has. A company’s familiar products do not guarantee future returns. Your decision should fit your financial goals, not only a recent price move.
What was the highest Apple stock ever been?
Apple’s highest end-of-day share price through October 2026 was $348.22 on Oct. 22, 2026. That record refers to a closing price, not necessarily the highest trade during that day. Intraday highs and closing prices are separate measures. A claimed record should also state whether historical prices have been adjusted for stock splits.
How high will Apple go in 2026?
No analyst target sets a ceiling for Apple’s share price in 2026. The October 2026 analyst 12-month target range was $245 to $400 per share, but those targets were estimates, not guarantees. Actual prices can move beyond a forecast range. The 12-month horizon also differs from a fixed calendar-year price limit.
What was Apple’s lowest stock price ever?
The lowest end-of-day price in the historical series, adjusted for splits, was $0.03768 on July 8, 1982. That figure restates the earlier per-share price to account for later stock splits. It is not the same as an unadjusted trade price from that day. Historical charts should identify whether they show split-adjusted or raw prices.