What if the alert that saves your weekend costs less than the coffee you drink while reading it? That is not a fantasy. Plenty of teams run solid application monitoring for the price of a small server and some engineering patience. The catch is that “low-cost” means two very different things depending on who is asking. For one team it means a free open-source stack. For another it means a SaaS bill that does not explode when traffic triples. This guide walks through the realistic options, where the hidden costs hide, and how to pick a setup that stays cheap after month three, when the free tier runs out and the real invoices begin. (Cloud cost management tools that actually cut your bill)
What Low-Cost Really Means in Monitoring
Most buying guides compare list prices. That is the wrong number. The number that matters is total cost of ownership, and it has three parts: licences, infrastructure, and people. (Review 2027 free tools actually cost you)
Licences are the obvious one. Infrastructure covers the servers, storage, and bandwidth your monitoring consumes. People covers the hours someone spends installing, upgrading, and debugging the thing. A free tool that eats ten engineering hours a month is not free. A paid tool that removes those ten hours may be the cheaper option.
There is a second trap. Monitoring costs scale with cardinality and volume. Metrics with many unique label combinations, high-frequency scrapes, and long log retention all multiply. A tool that looks cheap at 20 hosts can look frightening at 200. The same logic applies across software categories: many teams discover that free tiers carry a real price once usage grows. Monitoring follows the same curve.
The Open-Source Core: Prometheus and Grafana
The default low-cost answer for metrics is Prometheus, first released publicly in 2012 and a graduated project of the Cloud Native Computing Foundation since 2018. It scrapes HTTP endpoints on a schedule, stores time series locally, and answers questions through PromQL, its own query language. Pair it with Grafana, open-sourced in 2014, and you get dashboards that rival commercial products.
The cost profile is attractive: no licence fee, and the software runs on modest hardware for small and mid-sized estates. The trade is operational work. Someone has to run the server, manage retention, back up the data, and upgrade components. Prometheus also stores data locally by default, so long-term retention at scale usually needs a remote-write target, which adds another moving part.
Practical tip: start with a single Prometheus instance and a short retention window, say 15 days. Most debugging questions are answered by recent data. Extend retention only when a real incident proves you need it.
Common mistake: instrumenting everything on day one. Every extra metric and label combination costs storage and query time. Start with the four golden signals (latency, traffic, errors, saturation) and add more only when a question demands it.
OpenTelemetry Keeps You From Being Locked In
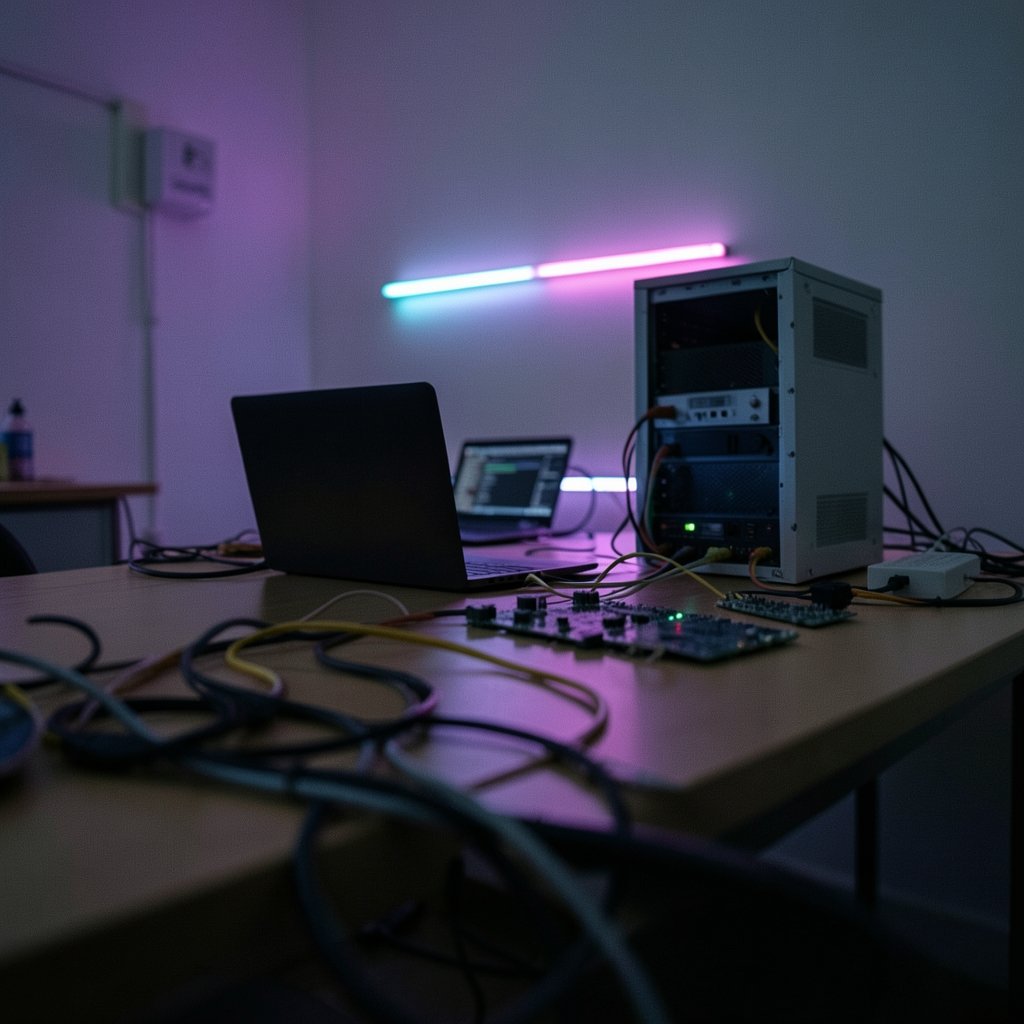
The smartest cost decision is often made before you pick a vendor. OpenTelemetry is the vendor-neutral standard for instrumenting applications. It merged the OpenTracing and OpenCensus projects in 2019, and its metrics specification reached stability around 2023, with traces stable earlier. The practical benefit is simple: instrument once, then send the data wherever it is cheapest today, and move it later without rewriting your code.
That portability is a bargaining chip. Teams that can switch backends negotiate better renewals and avoid the slow creep of a platform that raises prices once your data lives there. If you are choosing a stack from scratch, think carefully about how instrumentation fits into the wider build decisions.
One caveat worth stating plainly: OpenTelemetry is a standard, not a product. It does not store or display anything by itself. You still need a backend, whether self-hosted or hosted.
Hosted Open-Source: The Middle Path
Managed Grafana and managed Prometheus services sit between do-it-yourself and full SaaS. You keep the open-source APIs and dashboards, but someone else handles upgrades and availability. The cost model usually reintroduces per-seat or per-metric pricing, so read the fine print on active series and retention.
This category suits teams that want open standards without hiring a dedicated platform engineer. It rarely suits teams with very high metric volume, where per-series pricing can climb faster than a self-hosted box would cost.
| Option | Upfront Cost | Ongoing Cost | Best For |
|---|---|---|---|
| Self-hosted Prometheus and Grafana | Low | Server plus staff time | Teams with ops skills and steady volume |
| Managed open-source service | Low to medium | Per-series or per-seat fees | Small teams without ops capacity |
| SaaS monitoring with free tier | None | Usage-based after caps | Early-stage products and prototypes |
| Self-hosted uptime checker | Very low | One small server | Basic availability checks |
Free Tiers: Great Until They Are Not
Many SaaS monitoring vendors offer usage-capped free plans, typically limited by hosts, metrics, or retention. These are a legitimate way to start. They are also where budgets quietly break, because the caps change often and the overage pricing is rarely the headline.
Before committing, answer three questions. What happens at the cap: does data stop, or does billing start? How is usage counted: per host, per custom metric, per million spans? And does alerting come included, or is it a separate paid feature?
That last point trips up a lot of teams. Free tiers frequently exclude or limit alerting, paging, and status pages. You can end up with beautiful dashboards and nobody woken up when the site goes down. The base price is the least interesting number on the page.
Uptime and Synthetic Checks on a Budget
Not every monitoring problem needs a full observability platform. If the core question is “is it up, and is it fast from three regions,” a lightweight uptime checker does the job. Uptime Kuma is a well-known open-source, self-hosted option that covers basic availability checks at no licence cost. Hosted ping services also offer cheap or free tiers for simple HTTP checks.
The honest limitation: uptime checks tell you something is broken, not why. They complement metrics and logs, they do not replace them. A common mistake is buying an expensive observability suite when an uptime checker plus a few key dashboards would have covered 80 percent of real incidents.
Logs Are Usually the Cost Driver
If your monitoring bill surprises you, look at logs first. Volume-based log pricing escalates quickly because applications are chatty, and retention multiplies the problem. Metrics are compact by comparison.
The standard controls are sampling, tiered retention, and label-based indexing. Grafana Loki, released in 2018, was built around the idea of indexing labels rather than full log text, which keeps storage costs down compared with full-text indexing engines. Self-hosting Loki is a realistic option for teams already running Grafana.
Practical tip: set a hard retention limit on debug logs, often seven days, and keep audit or error logs longer. Most teams never query logs older than a month, yet pay to store them for a year.
Alerting and On-Call: The Cost Nobody Budgets
Alerting is where cheap monitoring meets expensive reality. Paging, escalation policies, and status pages are often priced separately, sometimes per user. A free monitoring plan with a paid on-call add-on can cost more than a mid-tier all-in-one plan.
Two habits keep this cheap. First, alert on symptoms that matter to users, not on every metric threshold; alert fatigue is a cost measured in staff turnover. Second, route alerts through a single channel with clear ownership. Teams that skip this step end up paying for tools nobody trusts. (True cost free ai tools 2027 youre really paying)
Monitoring budgets are not exempt from the pattern of hidden fees that shows up across software buying.
Security Monitoring Is a Separate Budget Line
Application monitoring and security monitoring overlap but are not the same purchase. If you need log correlation for threats, expect a different pricing model, often tied to data ingest per day. That model punishes verbose sources, so filter at the source before shipping. For most small teams, the low-cost move is to keep security logging separate from application metrics and to cap ingest deliberately.
A Step-by-Step Approach That Stays Cheap
- Define the questions you need answered before buying anything. “Is checkout working” is a different question from “why is checkout slow.”
- Instrument with OpenTelemetry so the backend stays swappable.
- Start with self-hosted Prometheus and Grafana, short retention, four golden signals only.
- Add an uptime checker for external availability, ideally self-hosted.
- Add logs only when metrics fail to explain an incident, with sampling and a hard retention cap.
- Review usage monthly. Check active series, log volume, and seat count against the previous month.
- Negotiate or migrate when growth outpaces the plan. Portability gives you bargaining power.
Where Teams Usually Go Wrong
The most common error is buying a platform before knowing the questions. The second is ignoring cardinality: a single label with user IDs attached can multiply storage costs overnight. The third is treating monitoring as a one-time purchase rather than a monthly review item.
A quieter mistake is under-investing in dashboards. A cheap tool with good dashboards beats an expensive tool nobody opens. Spend the saved licence money on a few hours of dashboard design instead.
Cloud spend discipline applies here too. Monitoring infrastructure runs on cloud resources, and the same habits that tame compute bills tame observability bills.
Conclusion
The best low-cost application monitoring setup is not a single product. It is a small stack with clear jobs: Prometheus and Grafana for metrics, OpenTelemetry for portability, a lightweight uptime checker for availability, and logs added sparingly with hard retention limits. That combination keeps licences near zero and puts the real cost where it belongs, in a manageable amount of engineering time. Teams that prefer SaaS should treat free tiers as a trial, not a home, and read the overage terms before the first invoice arrives. Cheap monitoring is not about finding the lowest price. It is about knowing exactly what you are paying for, and refusing to pay for data nobody queries.
Frequently Asked Questions
What is the cheapest way to monitor an application?
For most teams, self-hosted Prometheus and Grafana is the cheapest starting point because there are no licence fees. The real cost is a small server plus the time to run it. Add a self-hosted uptime checker for availability and you have solid coverage for very little money.
Is free monitoring software good enough for production?
Often yes, with conditions. Free tiers and open-source tools can handle production workloads, but you must check what happens at usage caps, whether alerting is included, and how retention is limited. Free plans that exclude paging can leave you blind during an outage.
Why do monitoring bills grow so fast?
Two reasons: cardinality and log volume. Metrics with many unique label combinations multiply storage and query costs, and verbose logs with long retention escalate quickly under volume-based pricing. Both are controllable with sampling, label discipline, and retention caps.
Do I need OpenTelemetry if I already use a monitoring vendor?
It is not mandatory, but it is valuable. OpenTelemetry lets you instrument once and switch backends without rewriting code. That portability gives you bargaining power at renewal time and protects you if a vendor changes pricing.
How much log retention should a small team keep?
A common practical rule is seven days for debug logs and longer for errors and audit records. Most teams rarely query logs older than a month, so paying to store them for a year is usually wasted spend. Set the limit deliberately rather than accepting the default.
Can uptime checks replace full application monitoring?
No. Uptime checks tell you whether a service responds, not why it is slow or failing. They are a cheap and valuable layer, but they work best alongside metrics and targeted logs rather than as a replacement.