What if the most repeated statistic about farm drones is also the one nobody can quite pin down? Search for “farm drones 16.4 million acres” and you will find a confident-sounding figure attached to a percentage, usually 59 percent, and a pair of years, 2025 and 2026. The problem is that the number travels faster than its source. Before anyone budgets six figures for an aerial spraying fleet, it is worth understanding what these figures claim, where they come from, and how to check them yourself.
Where the 16.4 Million Acre Figure Comes From
The headline claim, as it circulates, is that drones treated or scouted roughly 16.4 million acres of farmland, that this represented about 59 percent of some measured category, and that the trend lines point toward 2026. Stripped of context, that sounds like a revolution already in progress.
In practice, figures like this almost always originate from one of a handful of places: an industry trade group’s annual survey, a manufacturer’s marketing report, a university extension study, or a federal agency’s registration data. Each measures something different. A drone manufacturer counting “acres flown” may include multiple passes over the same field. A trade association survey may rely on self-reported numbers from its own members. A government dataset might count registered aircraft rather than acres at all.
That distinction matters enormously. 16.4 million acres is roughly the size of West Virginia, and if a reader assumes it means unique farmland treated by drone in a single season, they will draw very different conclusions than if it means cumulative flight coverage across all operators, all crops, and all mission types.
Why the 59 Percent Is the Harder Number
Percentages are where agricultural statistics get slippery. Fifty-nine percent of what? Of large farms? Of acres treated by any aerial method? Of surveyed growers who said they had “tried” a drone at least once?
A grower who flew a drone over a field once for a demo counts differently than one who built drone spraying into a full-season operating plan. Surveys rarely separate the two, and press coverage rarely asks. When you see a percentage attached to farm drone adoption, the first question to ask is always: percent of what population, in what year, measured how? (Agricultural drone)
What Actually Drives Drone Adoption on Farms
Setting the disputed headline aside, the practical forces pushing drones onto farms are well documented and easy to verify at the field level.
Spraying and Seeding in Places Tractors Cannot Go
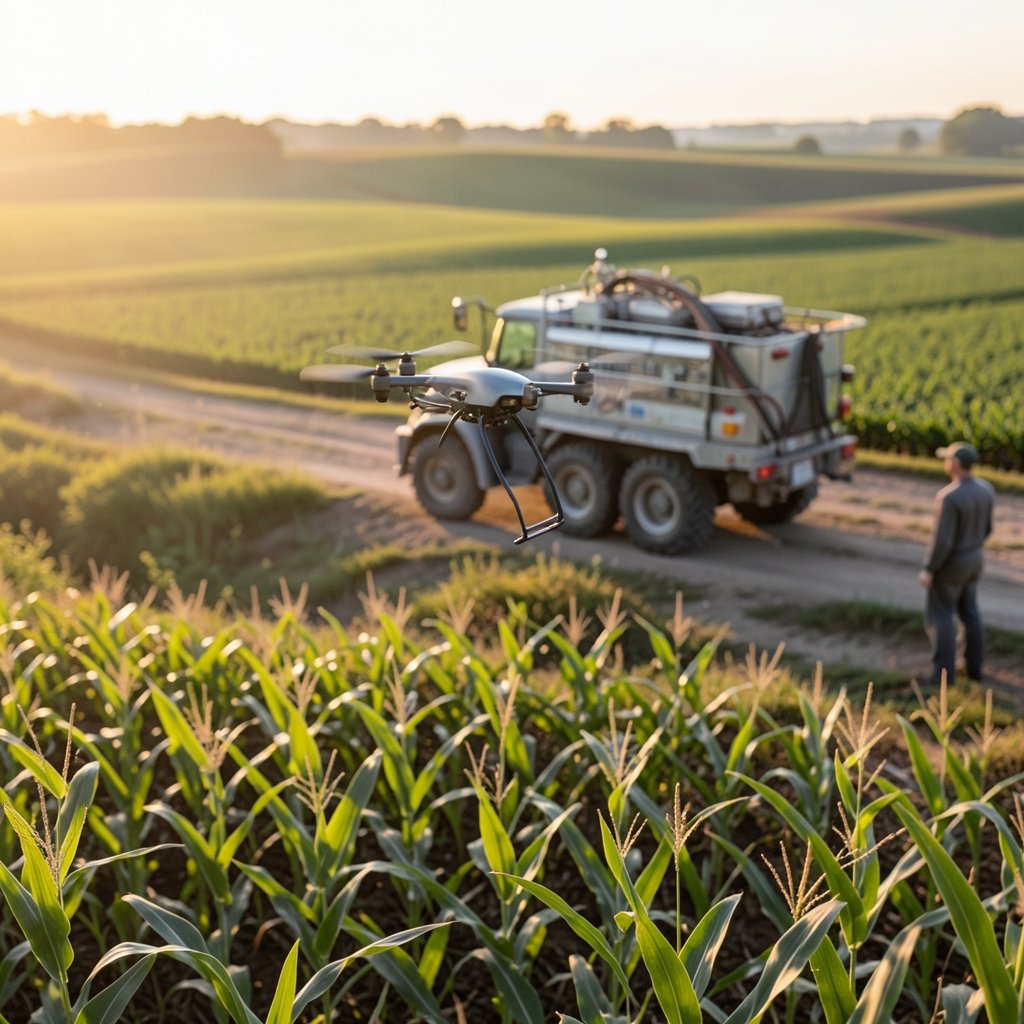
The strongest use case is spot spraying on wet ground, steep terrain, and small or fragmented plots where a ground rig either cannot enter or cannot justify the trip. A drone carrying 10 to 40 liters can treat a few acres per flight, refill, and repeat. For a grower with 40 scattered acres of specialty crops, that is a genuine operational win. For a 4,000-acre corn operation, the economics are much harder to justify.
Scouting and Stand Counts
Aerial imagery for crop scouting, stand counts, and drainage mapping is the lowest-barrier entry point. The equipment is cheaper, the regulatory path is simpler, and the output, a map a farmer can act on, is easy to understand. This is where most first-time users start.
The Regulatory Gate
In the United States, agricultural spraying by drone requires specific certification and exemptions layered on top of standard remote pilot rules. The practical effect is that adoption clusters around operators who have invested in compliance, which means the acreage numbers are concentrated among a relatively small number of service providers rather than spread evenly across all farms. Anyone tracking policy shifts in adjacent technology sectors knows how fast licensing rules can reshape a market; the same dynamic appears in coverage of the Starlink South Africa licensing dispute, where regulatory thresholds, not demand, decided who got service.
Common Mistakes When Reading Drone Adoption Statistics
Having watched how these numbers get used and misused, a few patterns repeat often enough to warn about.
- Treating cumulative coverage as unique acres. A field flown five times is five times the coverage and one time the acreage. Reports rarely clarify which they mean.
- Mixing survey years. A “2025” figure may describe the 2024 growing season, published in 2025. A “2026” projection is usually an extrapolation, not a measurement.
- Ignoring the denominator. Fifty-nine percent of surveyed growers in one state’s specialty-crop sector is not fifty-nine percent of national farmland.
- Assuming service-provider acres belong to the farm. Most drone acreage today is flown by custom applicators, so the farmer may never own a drone at all.
- Forgetting weather. A wet spring can double drone spraying demand in one region and zero it in another. Single-year numbers swing wildly for reasons that have nothing to do with adoption.
The practical fix is simple: when a drone statistic crosses your desk, find the original source document, read the methodology note, and check whether the number is acres, flights, dollars, or respondents.
How to Verify a Farm Drone Statistic Yourself
This is the part most articles skip, and it is the part that actually helps. Here is a workable process.
- Search the exact phrase in quotes. Query the precise figure, for example “16.4 million acres” alongside “drone.” If the only results are press releases citing each other, you have found a circular citation, not a measurement.
- Go to primary agricultural data. National agricultural statistics agencies publish technology adoption tables from periodic censuses. These are slower and less exciting than trade surveys, but they are auditable.
- Check aviation regulators. Registration counts and agricultural aircraft operator databases tell you how many commercial operators exist, which bounds how many acres could plausibly be flown.
- Read the methodology section, not the summary. Look for sample size, response rate, and whether respondents were randomly selected or self-selected.
- Compare two independent sources. If a trade group and a university extension survey land within 20 percent of each other, the direction is probably real. If they are off by a factor of five, one of them is measuring something else.
That last step is where most confident claims fall apart. Triangulation beats any single headline.
The Economics: What a Drone Acre Actually Costs
Numbers aside, growers decide based on cost per acre. The rough shape of the math looks like this.
| Cost Factor | Ground Rig | Drone Service |
|---|---|---|
| Mobilization to small plots | High, often prohibitive | Low |
| Cost per acre on large, flat fields | Low | Higher |
| Access to wet or steep ground | None | Good |
| Water volume per acre | High | Low to moderate |
| Operator certification burden | Standard | Additional aerial-specific requirements |
| Best fit | Large contiguous acreage | Fragmented, specialty, or difficult terrain |
The pattern is consistent: drones win on access and flexibility, ground rigs win on volume and cost at scale. Any statistic implying drones have broadly replaced ground application should be read with that in mind.
The 2026 Projection Problem
Forecasts are where the 59 percent figure usually lives. A 2026 number in a 2025 report is, almost by definition, a model output. Models are useful, but they inherit every assumption baked into them, and agricultural models are especially sensitive to three inputs: crop prices, labor availability, and regulation.
When crop prices fall, capital spending on new equipment falls with it. When labor is scarce, automation looks better. When regulators tighten or loosen aerial application rules, the addressable market can shift overnight. That sensitivity is not unique to agriculture. Similar dynamics show up in coverage of the Apple App Store fee dispute heading to the Supreme Court, where a single legal outcome reshapes an entire revenue model, and in reporting on Kalshi’s college football expansion odds, where a percentage is explicitly a market-implied probability rather than a measurement of anything that has happened.
The lesson transfers directly: a 2026 percentage is a bet, not a census. Treat it as a scenario, not a fact.
What Would Make the Headline Credible
For the 16.4 million acre claim to hold up, a few things would need to be true and documented.
- A named organization published the figure with a stated methodology and sample.
- The unit of measurement is defined: unique acres, treated acres, or flight coverage.
- The 59 percent has an explicit denominator and a survey date.
- The 2026 figure is labeled as a projection with stated assumptions.
- Independent data, such as operator registrations or census adoption tables, is consistent with the scale claimed.
If even two of those are missing, the number is a marketing artifact. That does not make it false. It makes it unverified, and unverified numbers should not drive equipment purchases. (FAA Advanced Operations)
Practical Advice for Growers Evaluating Drones
For anyone actually considering the technology, the useful questions are local, not national.
Start with a single field trial on your hardest-to-reach ground. Measure the cost per acre against your current method, including refill time and travel. Ask a service provider for their certification details and insurance. Then ask what happens when it rains for a week, because that is when aerial capacity gets scarce and prices rise.
Most importantly, ignore national acreage statistics when making the decision. A number describing 16.4 million acres somewhere else tells you almost nothing about whether a drone makes sense on your 300 acres of hilly orchard. The technology is real and improving. The headline number is not yet a reliable guide to anything.
Conclusion
The “16.4 million acres, 59 percent, 2025 to 2026” framing is a useful prompt to ask better questions, not a settled fact. Agricultural drone use is genuinely growing, driven by access to difficult terrain, spot spraying, and scouting. But the specific figures circulating online are difficult to trace to a primary, methodologically sound source, and they are routinely stripped of the context that would make them meaningful. Growers and analysts alike are better served by checking denominators, reading methodology notes, and triangulating against independent data. When a statistic cannot survive that process, it belongs in a marketing deck, not an operating plan.
FAQ
What does the 16.4 million acre farm drone figure actually measure?
It depends entirely on the source, and that is the core problem. Depending on who published it, the number could mean unique acres treated, cumulative flight coverage across multiple passes, or total acres scouted with imagery. Without the original methodology document, the figure cannot be interpreted reliably, and readers should treat it as unverified until a primary source is located.
Is 59 percent a real adoption rate for farm drones?
Not in any national sense that can be confirmed. Percentages in this space usually describe a narrow population, such as surveyed members of a trade group or growers in one crop sector, rather than all farmland. A 59 percent figure attached to a self-selected survey sample says far less than it appears to, and the denominator is almost always the missing piece.
Why do drone acreage numbers vary so much between reports?
Because they measure different things. Some count flights, some count acres, some count dollars spent, and some count respondents who answered a survey. Weather also swings single-year figures dramatically, since a wet spring can multiply drone spraying demand in one region while leaving another untouched. Comparing two reports without checking units and years produces false conflicts.
How can a grower check whether drone spraying makes financial sense?
Run a trial on the hardest-to-reach field and measure cost per acre against the current method, including refill time and travel. Drones tend to win on fragmented, steep, or wet ground and lose on large flat fields where ground rigs are efficient. National statistics are a poor guide; local cost per acre is the only number that matters for the decision.
What regulatory factors affect farm drone adoption?
Aerial application by drone requires certification and exemptions beyond standard remote pilot rules, which concentrates adoption among professional service providers rather than individual farms. Regulatory changes can expand or shrink the addressable market quickly, and any 2026 projection that ignores policy risk should be treated as optimistic rather than analytical.
Are the 2026 projections reliable enough to plan around?
Treat them as scenarios, not forecasts with precision. Projections inherit assumptions about crop prices, labor availability, and regulation, all of which move independently of drone technology itself. A percentage describing a future year is a model output, and models are only as good as the inputs behind them, so plan around your own field data instead.