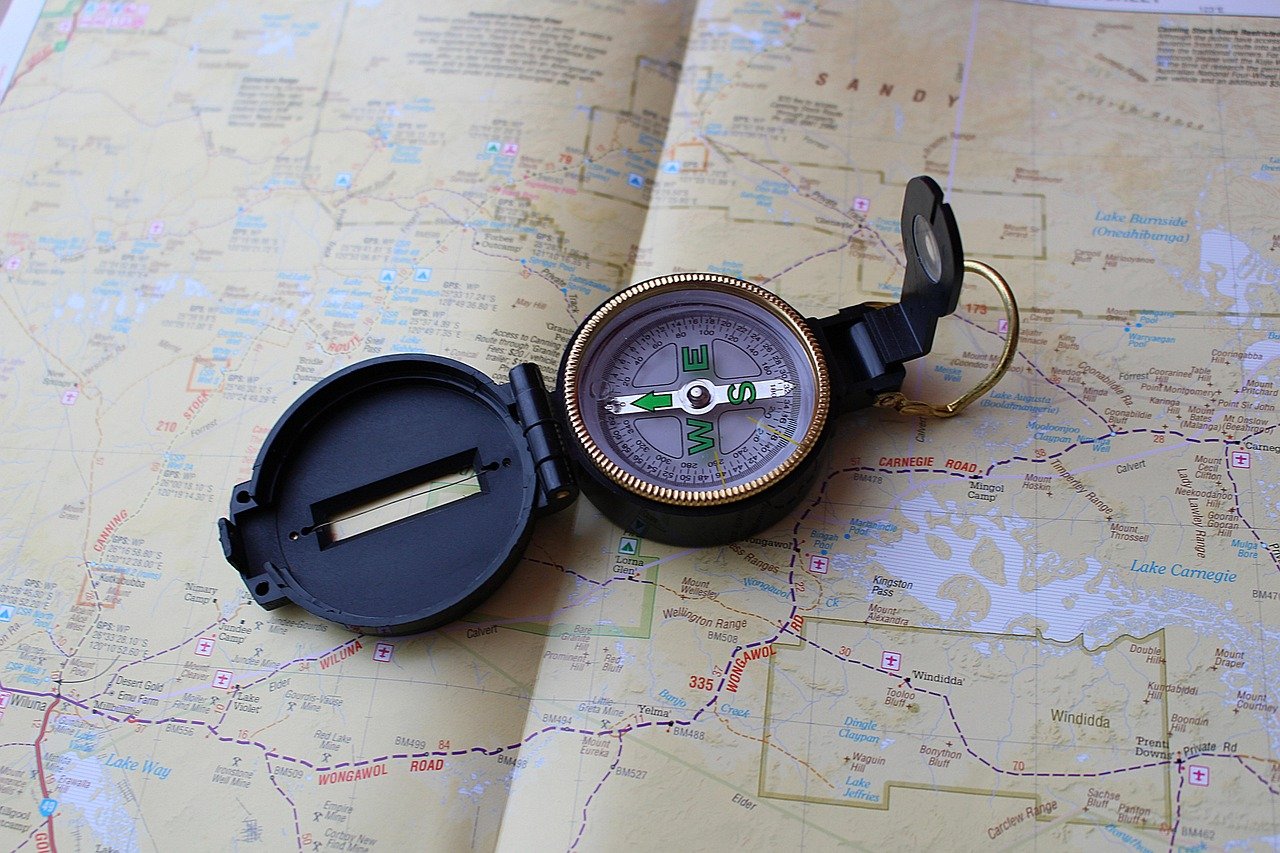
When was the last time you unfolded a paper map and actually understood what you were looking at? For most people, the answer is “not recently” or “never.” Phone navigation has made us passengers rather than navigators. You type a destination, a blue line appears, and you follow it. That works fine until the battery dies, the signal drops, or you need to explain a location to someone else without a screen in your hand.
Reading a map is a learnable skill, and it is not complicated. It comes down to a handful of elements: scale, symbols, grid lines, contours, and orientation. Once those click, a flat piece of paper becomes a picture of real ground. This guide walks through each element in plain terms, with the mistakes people make most often and the habits that fix them.
Start With the Legend, Not the Lines
The single most common mistake beginners make is diving straight into the map’s lines and colors. Every map is a code, and the legend (sometimes called the key) is the decoder. It tells you what each symbol, color, and line type means on that specific map. (Map)
Here is the catch: the legend is not universal. A blue line might mean a river on one map and a hiking trail on another. A dashed line might mark a footpath, a boundary, or an intermittent stream. A legend is map-specific, which is why experienced map readers glance at it first, every time, even on familiar map series. (Map)
Practical habit: before you look at anything else, spend thirty seconds scanning the legend. Note the symbols for roads, water, buildings, and boundaries. Note the color scheme. Then read the map itself. This one habit prevents most of the misreadings that send people down the wrong trail.
Scale: What the Numbers Actually Mean
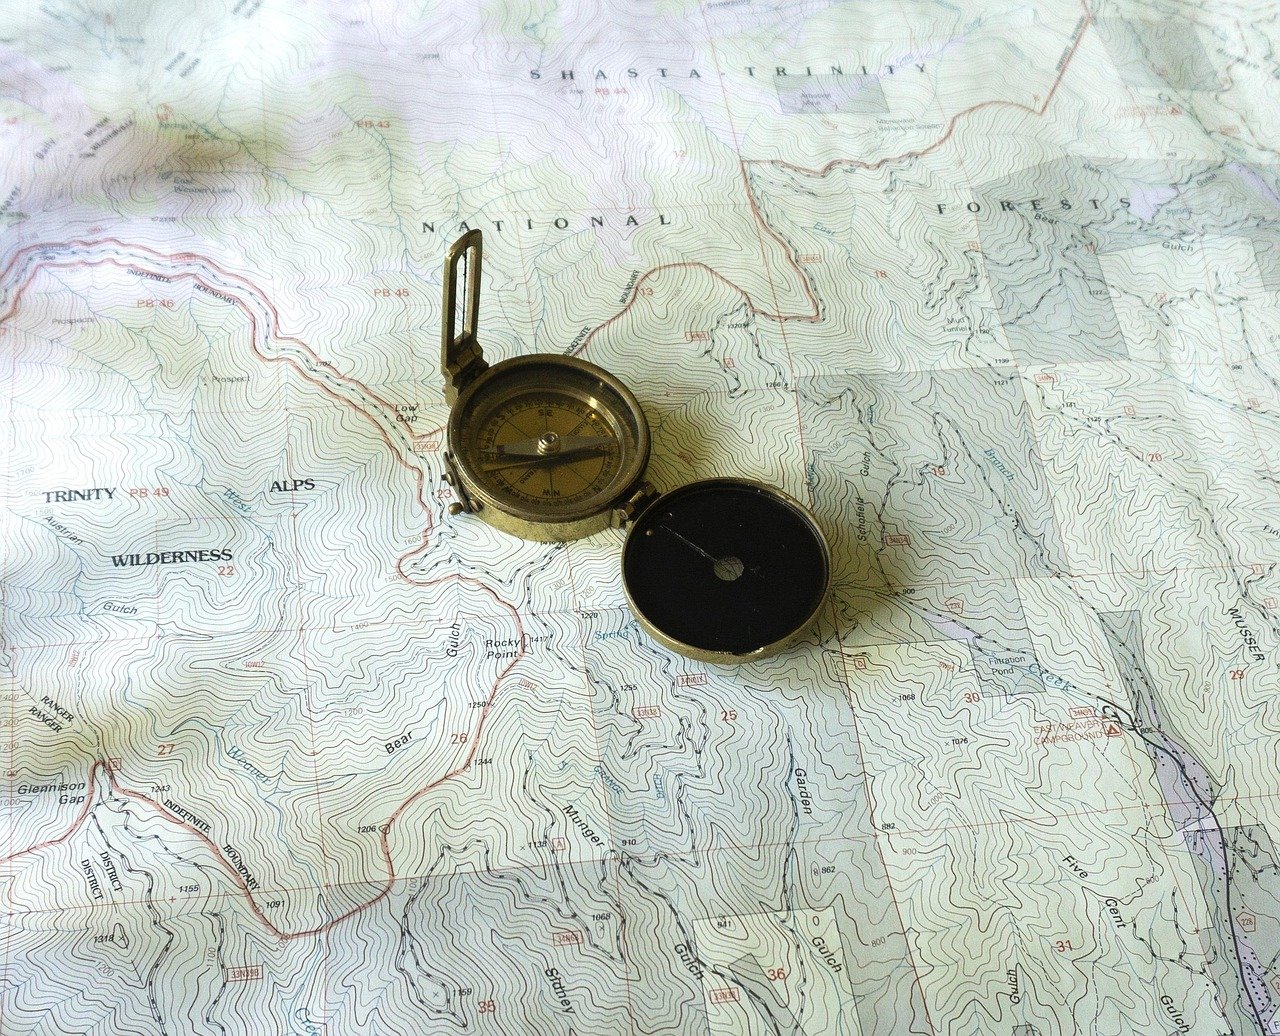
Scale tells you how much the map has shrunk the real world. It usually appears as a ratio, such as 1:50,000, which means one unit on the map equals 50,000 of the same units on the ground. In practical terms, 1 centimeter on a 1:50,000 map covers 500 meters of real terrain. The ratio and representative fraction used in map scales) are worth understanding because they govern how much detail a map can show.
The trade-off is simple and unavoidable:
| Scale | Example | Shows | Best for |
|---|---|---|---|
| Large scale | 1:25,000 | Lots of detail, small area | Walking, field work, property lines |
| Medium scale | 1:50,000 | Balanced detail and coverage | Hiking, cycling, regional planning |
| Small scale | 1:250,000 or smaller | Broad coverage, little detail | Road trips, regional overview |
A large-scale map shows a small area in detail. A small-scale map shows a large area with less detail. People mix this up constantly, so remember: large scale equals close up.
Most maps also include a scale bar, a graphic ruler you can use to measure distances directly. To measure a route, lay a straight edge or a piece of paper along the path, mark the start and end, then compare that length to the bar. On winding roads or trails, bend the paper along the curves or use a piece of string.
Grid References: Along the Corridor, Up the Stairs
Many topographic maps are covered in a grid of thin lines. These let you pinpoint a location precisely. The convention differs by country, so do not assume one system applies everywhere.
In the UK National Grid system, a six-figure grid reference identifies a 100-meter square. You read the easting (the horizontal value) first, then the northing (the vertical value). The memory trick is “along the corridor, up the stairs”: go along the bottom axis, then up the side. The step-by-step method for reading a UK grid reference explains the easting-first order and how to estimate within a square.
Other countries use different systems, such as UTM (Universal Transverse Mercator) or local national grids. The principle is similar, but the numbers and conventions are not interchangeable. If you are navigating in an unfamiliar country, check which grid system the map uses before relying on coordinates from another source.
Latitude and Longitude
Global coordinates work differently from grid references. Latitude measures degrees north or south of the equator, from 0° at the equator to 90° at the poles. Longitude measures degrees east or west of the Prime Meridian, from 0° to 180°. The geographic coordinate system uses degrees, minutes, and seconds, and the Prime Meridian at Greenwich was fixed by international convention in 1884.
A common mistake: mixing up latitude and longitude when reading coordinates aloud. Latitude always comes first in the standard convention. If someone gives you a coordinate pair and the first number is larger than 90, something is wrong, because latitude cannot exceed 90°.
Contour Lines: Reading the Shape of the Land
Contour lines are the feature that separates a flat map from a three-dimensional understanding of terrain. A contour line joins points of equal elevation. Where lines are close together, the ground is steep. Where they are far apart, the ground is gentle. Concentric circles mean a hilltop or a depression, depending on whether the map marks them with hachures.
The contour interval is the vertical distance between adjacent lines, and it is printed in the legend. On one map it might be 10 meters; on another, 40 feet. Always check the interval before you interpret the spacing, because the same visual pattern means very different slopes at different intervals. The USGS explanation of contour lines and contour intervals covers how to read them and why the interval matters.
Practical tips that actually work:
- Find the index contours first. These are usually thicker lines labeled with their elevation, and they anchor your reading.
- Trace a line with your finger to see the shape of a ridge or valley. Contours that form a V pointing uphill indicate a valley or stream.
- Look for closed loops. A loop with no hachures is a hill; hachures (small tick marks pointing inward) mark a depression.
- Check the interval before judging steepness. Close lines on a 10-meter interval are a gentle slope on a 100-meter interval.
People often misjudge a route by ignoring contours entirely. A trail that looks short on the map can climb 600 meters, and the contour lines told you so the whole time.
Orientation: Which Way Is North?
Not every map is oriented with north at the top, and even when it is, “north” needs a definition. There are three of them, and confusing them causes real navigation errors.
True north is the direction of the geographic North Pole. Magnetic north is where a compass needle points, and it moves slowly over time. Grid north is the direction of the grid lines on a projected map. The difference between true north and magnetic north is called magnetic declination, and it varies by location and changes gradually. Navigators must correct for it, and the NOAA explanation of magnetic declination covers why the value shifts and how it is tracked.
Most topographic maps print a declination diagram in the margin showing the angle between true north, magnetic north, and grid north. If you are using a compass with a map, this diagram is not optional reading.
A north arrow on the map confirms orientation. If a map lacks one, check the grid lines or the margin notes. Some trail maps and illustrated maps are rotated for layout reasons, and assuming north-up on such a map will send you the wrong way at the first junction.
Symbols, Colors, and the Things Maps Leave Out
Beyond the legend, a few conventions appear on most maps:
- Blue usually indicates water: rivers, lakes, streams, and sometimes wetlands.
- Green often marks vegetation, parks, or forest cover.
- Brown typically shows contour lines and elevation.
- Black tends to mark human-made features such as buildings, roads, and boundaries.
- Red often highlights major roads or special routes, though this varies.
These are conventions, not laws. The legend always wins over your assumptions.
Equally important is what maps leave out. A map is a simplification, and the cartographer chose what to include. A trail junction that exists on the ground might not appear on a small-scale map. A seasonal stream might be drawn as permanent. A new building might postdate the survey. Treat the map as a strong guide, not an infallible record, and cross-check with what you see.
Paper Versus Digital: What Changes
Digital maps are convenient, but they hide some of the cues that paper maps make explicit. Web maps often auto-rotate to match your heading and auto-zoom as you move. That means the scale changes without you noticing, and north is not always up. If you have ever tried to follow a phone map while walking and felt disoriented, this is part of the reason.
A practical fix: lock the map to north-up when you need to compare it with the real world, and check the scale bar before estimating distances. If you are troubleshooting a stubborn device issue, the same principle of checking the basics applies to other tech problems, like when a robot vacuum keeps deleting its map and you need to fix it by resetting the saved layout rather than guessing at the app.
Paper maps have their own advantages. They show the whole area at once, they do not need power, and they force you to engage with scale and orientation. Many experienced hikers carry a paper map and compass as a backup even when using GPS. The USGS topographic map program publishes official topographic maps for the United States, and the series has been produced since the late 19th century, now in digital form.
Common Mistakes and How to Avoid Them
After watching beginners struggle, a few errors come up again and again:
- Skipping the legend. The map’s symbols are not universal. Read the key first.
- Ignoring the scale. A route that looks short on a small-scale map can be a full day’s walk.
- Misreading contour spacing. Close lines mean steep ground, but only relative to the stated interval.
- Assuming north is up. Check the north arrow and the declination diagram.
- Mixing up grid systems. A UK grid reference will not work on a UTM map.
- Trusting an outdated map. Roads change, trails close, and buildings appear.
The fix for most of these is a thirty-second pre-flight check: legend, scale, north arrow, contour interval. Do that before you start navigating, and most errors disappear.
Building the Skill
Map reading improves with repetition, and the best practice is low-stakes. Pick a map of your own neighborhood and try to match features to what you see on a walk. Find a hill on the map and confirm it exists. Measure a route with the scale bar and compare it to your actual walking time. Plot a grid reference for a landmark and check it against a known point.
If you want to go further, the same attention to detail helps with other technical tasks, whether you are learning to map a network drive in Windows 11 without headaches or figuring out how to check iPhone battery health and read the results correctly. The pattern is the same: understand the key, check the scale, and do not assume the defaults are right.
Conclusion
Reading a map is not a nostalgic skill reserved for hikers and surveyors. It is a way of translating a flat sheet of paper into a three-dimensional picture of the ground, and it makes you harder to mislead, whether by a dead phone or by a route that looked shorter than it was. The core elements are few: read the legend, check the scale, learn the grid convention, interpret the contours, and confirm which way is north. Practice them on familiar ground, and unfamiliar ground becomes far less intimidating. The map was never the hard part. Knowing what to look at first was, and now you do.
FAQ
What is the first thing to look at on a map?
The legend, also called the key. It decodes the symbols, colors, and line types used on that specific map. Because symbols are not universal, reading the legend first prevents most misreadings.
What does a 1:50,000 scale mean in real distance?
It means one unit on the map equals 50,000 of the same units on the ground. In metric terms, 1 centimeter on the map covers 500 meters of real terrain. A 1:25,000 map shows more detail over a smaller area.
How do I read contour lines to tell if a hill is steep?
Look at how close the lines are. Closely spaced contours mean a steep slope; widely spaced ones mean gentle ground. Always check the contour interval in the legend, because the same spacing means different slopes at different intervals.
Why do I need to correct for magnetic declination?
A compass needle points to magnetic north, which differs from true north by an angle that varies by location and changes slowly over time. The declination diagram in the map margin shows the correction, and ignoring it can put you off course over long distances.
What is the difference between latitude and longitude?
Latitude measures degrees north or south of the equator, from 0° to 90°. Longitude measures degrees east or west of the Prime Meridian, from 0° to 180°. Latitude is always given first in a coordinate pair.
Are digital maps just as good as paper maps?
They are convenient but hide some cues. Web maps often auto-rotate and auto-zoom, which obscures scale and orientation. Lock the map to north-up and check the scale bar when accuracy matters, and consider carrying a paper map as a backup.