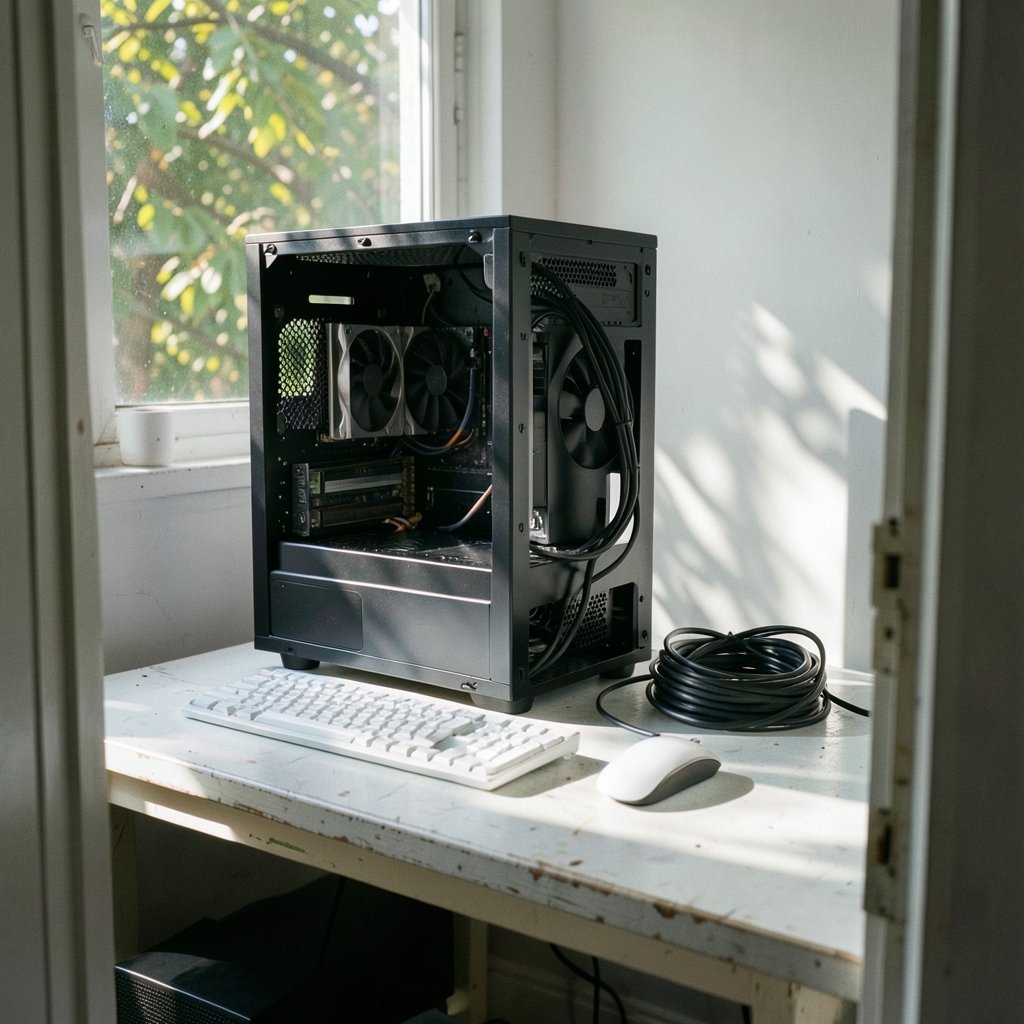
What graphics card is actually inside that PC? Most people think they know, until a game stutters, a video export crawls, or a driver update fails, and suddenly the exact model, memory size, and driver version matter. The good news is that Windows hides all of this in plain sight. You do not need to open the case or install anything to find out. (Graphics processing unit)
This guide walks through every practical way to check your GPU on Windows, from the one-click Task Manager view to the command line. It also covers the mistakes that trip people up, especially the confusing “shared memory” number that makes a 4 GB card look like it has 12 GB.
Start With Task Manager: The Fastest Check
Task Manager is the quickest way to see which GPU is installed and how hard it is working. Press Ctrl + Shift + Esc, then open the Performance tab and click GPU in the left column.
You get three useful things at once:
- The adapter name, such as “NVIDIA GeForce RTX 4060” or “Intel UHD Graphics 770”
- Real-time usage broken down by engine: 3D, Copy, and Video Encode/Decode
- Dedicated GPU memory and shared GPU memory figures
If the machine has two graphics processors, a common setup on laptops, you will see GPU 0 and GPU 1. The numbering does not tell you which one is faster. It only reflects the order Windows detected them. On most gaming laptops, the discrete card is the one you care about, and the integrated chip handles desktop work to save battery.
One practical tip: leave Task Manager open while you launch a game or a heavy app. Watching the 3D engine spike confirms which GPU the program is actually using. People often assume a game is running on the powerful card when Windows has quietly assigned it to the integrated one.
Use Device Manager to Confirm the Model and Driver

Device Manager is the classic Windows tool for identifying hardware, and it is still the most reliable place to check a driver version and date.
- Right-click the Start button and choose Device Manager.
- Expand Display adapters.
- Right-click your GPU and select Properties.
- Open the Driver tab to see the version, date, and provider.
The driver version here is the Windows-reported string, which often does not match the marketing number on the vendor’s website. NVIDIA, AMD, and Intel each number drivers differently, so do not panic if the numbers look unrelated. What matters is the date: a driver that is two years old is a common cause of crashes in newer games.
Device Manager is also where you spot trouble. A yellow warning triangle next to the adapter usually means the driver failed to load or Windows disabled the device after repeated errors. That is a hardware or driver problem, not a settings problem.
Run dxdiag for a Full Snapshot
The DirectX Diagnostic Tool is built into every modern version of Windows and produces a tidy summary of your graphics hardware. Press Win + R, type `dxdiag`, and press Enter. If a prompt asks about checking driver signatures, choose whichever option you prefer; it does not change the results.
Click the Display tab. You will see:
| Field | What it tells you |
|---|---|
| Name | The exact GPU model |
| Manufacturer | NVIDIA, AMD, Intel, or the laptop maker |
| Chip Type | The internal chip designation |
| Total Memory | Dedicated plus shared memory combined |
| Display Memory (VRAM) | The actual memory on the card |
| Driver Version and Date | What Windows is currently loading |
| Feature Levels | Which DirectX capabilities the card supports |
On a system with two GPUs, there will be a Display 1 and Display 2 tab. The Render tab, if present, shows whether the card supports hardware acceleration for audio and video. (Display and graphics drivers overview)
The Total Memory field is where many people get confused. It is not the card’s video memory. Look at Display Memory (VRAM) for the real figure. A card sold as 8 GB will show roughly 8 GB there, while Total Memory might read 16 GB or more because Windows adds shared system memory to the total.
Check GPU Details Through Windows Settings
For a quick look without leaving the modern interface, go to Settings > System > Display > Advanced display. On Windows 11 this shows the connected adapter and the current refresh rate. The exact layout has shifted between Windows 11 releases, so the wording may differ slightly on your build. If a menu item seems missing, it has probably moved rather than disappeared.
This screen is handy when you want to confirm that a monitor is running at its rated refresh rate, which is a separate but related headache. A 144 Hz monitor stuck at 60 Hz feels like a slow GPU but is really a display setting.
Use the Command Line When You Need Precision
Command-line tools are useful for scripting, remote support, or just getting a clean text output you can copy. In PowerShell, run:
`Get-CimInstance Win32_VideoController | Select-Object Name, DriverVersion, AdapterRAM`
That returns the adapter name, driver version, and reported memory. Be aware that AdapterRAM is unreliable on cards with more than 4 GB of VRAM because of how the value is stored. Treat it as a rough hint, not a specification.
The older `wmic path win32_VideoController get name` command still works on many systems, but Microsoft has deprecated WMIC and is phasing it out of Windows 11. The PowerShell CIM cmdlets are the supported replacement, so it is worth learning them now rather than later.
Check GPU Temperature and Load Under Stress
Knowing the model is only half the job. A card can be correctly detected and still throttle because of heat or a failing fan. To see temperatures, you need a monitoring utility, since Windows does not expose GPU temperature in Task Manager.
The standard approach is to install a tool such as GPU-Z or HWiNFO, both widely used for reading sensors, clocks, and VRAM type. Open the sensors view, then run a game or a benchmark for ten minutes and watch the numbers. A modern card typically idles in the 30s to 40s Celsius and climbs into the 70s or low 80s under load. Sustained temperatures near 90 C, or a clock speed that drops steadily while gaming, point to cooling problems such as dust-clogged fans or dried thermal paste.
If you want a step-by-step walkthrough of the temperature side, this guide on how to check GPU temperature in 13 steps covers the monitoring tools and safe ranges in more detail. It pairs well with a general check of CPU temperature on Windows 11, because a hot CPU can bottleneck a perfectly healthy GPU and make the graphics card look like the culprit.
Match the GPU to the Rest of the System
A GPU does not exist in isolation. Before blaming the card for poor performance, confirm the rest of the machine can keep up. Checking your PC specs on Windows 11 gives you the processor, memory, and storage picture in one pass, which makes it much easier to spot an obvious mismatch such as 8 GB of RAM paired with a high-end card.
Two other checks are worth doing at the same time:
- RAM speed. Memory running below its rated speed can cost frames in games. This explanation of why the RAM speed number confuses people clears up the common misreading.
- Storage health. A failing drive causes stutters that look like GPU problems. A practical guide to checking hard drive health on Windows 11 shows how to read the health status.
If the machine is also behaving oddly in other ways, such as pop-ups or unexpected slowdowns, it is worth ruling out malware with a proper virus check on a Windows PC before spending money on hardware.
Common Mistakes People Make
A few errors come up again and again when people check their graphics hardware.
Reading shared memory as VRAM. The single most common mistake. Task Manager lists dedicated and shared memory separately, and only the dedicated figure is on the card. A laptop with 4 GB of dedicated memory might show 12 GB total, and that does not make it a 12 GB card.
Trusting the sticker on a prebuilt PC. Retail listings sometimes describe a machine by its processor’s integrated graphics even when a discrete card is installed, or the reverse. Always verify in Task Manager or dxdiag.
Assuming both GPUs are active. On laptops, the integrated chip usually drives the built-in screen while the discrete card wakes up for games. If a game runs badly, check which adapter it is using before assuming the card is weak.
Ignoring the driver date. A card from 2021 with a driver from 2021 will struggle with software released in 2025. Updating the driver from the vendor’s official page, not a random download site, is the fix.
Checking only the model, not the behavior. A card can be correctly identified and still be throttling, overheating, or running below its rated clock. Model, driver, and live load should always be checked together.
When to Use a Dedicated Utility
Windows tools cover the basics well, but they stop short of clock speeds, fan curves, power draw, and BIOS details. If you are diagnosing a specific fault, overclocking, or checking whether a second-hand card has been modified, a dedicated utility is the right call. GPU-Z is the lightest option and needs no installation. HWiNFO is more thorough and logs sensor data over time, which helps when a problem only appears after an hour of gaming.
These are third-party tools, not Microsoft software, so download them only from their official sites. Avoid bundled “driver booster” packages that arrive with unrelated software attached.
A Simple Order of Operations
For most people, the fastest path looks like this:
- Open Task Manager and confirm the GPU name and dedicated memory.
- Open Device Manager and check the driver date.
- Run dxdiag if you need a full spec sheet to share with support.
- Install a monitoring tool and watch temperatures under load for ten minutes.
- Compare the results against the rest of the system before buying anything new.
That sequence takes about fifteen minutes and answers nearly every question a typical user has about their graphics hardware.
Conclusion
Checking a GPU on Windows is not complicated once you know where to look. Task Manager gives you the model and live usage in seconds. Device Manager confirms the driver. dxdiag produces a complete snapshot you can copy into a support ticket. Command-line tools handle the scripted cases, and a monitoring utility covers temperature and load. The real skill is reading the numbers correctly: dedicated memory is the card’s VRAM, shared memory is borrowed system RAM, and a driver date matters as much as a model name. Check all three, and you will never be surprised by what is inside the case again.
Frequently Asked Questions
How do I check my GPU without installing anything?
Press Ctrl + Shift + Esc, open the Performance tab, and click GPU. Windows shows the adapter name, dedicated memory, and live usage. For a fuller report, press Win + R, type dxdiag, and open the Display tab.
Why does Task Manager show more GPU memory than my card has?
Because it adds dedicated memory, which is on the card, to shared memory, which is borrowed from system RAM. Only the dedicated figure is the card’s actual VRAM. A 6 GB card may show 14 GB total, and that is normal.
How can I tell which GPU a game is using?
Leave Task Manager open on the Performance tab while the game runs. Watch which GPU shows activity in the 3D engine. On laptops with two adapters, the discrete card should spike when the game is active. If the integrated chip does the work instead, the game is assigned to the wrong adapter.
How do I check if my graphics driver is up to date?
Open Device Manager, expand Display adapters, right-click the GPU, and open Properties > Driver. Check the date. If it is more than a few months old, download the latest version from the card maker’s official site rather than a third-party updater.
Can I check GPU temperature in Windows without extra software?
Not reliably. Windows does not surface GPU temperature in Task Manager or Settings. You need a monitoring utility such as GPU-Z or HWiNFO to read the sensor. Some laptop maker utilities also display it.
What should I do if Windows does not detect my GPU?
Check Device Manager for a warning icon under Display adapters or an entry under Other devices. Reseat the card if it is a desktop, confirm the monitor cable is plugged into the card rather than the motherboard, and reinstall the driver. If the card is missing entirely, it may be a power or slot problem.