
What happens when a factory built to stamp out 125,000 trucks a year only manages to move a fraction of that number onto driveways? That is the puzzle in the Cybertruck story, and it is less about demand curves than about the messy, unglamorous work of building something new.
Tesla started handing Cybertruck keys to customers on 30 November 2023 in Austin, Texas. Since then, the truck has generated more headlines than registrations. The gap between what Giga Texas can theoretically produce and what actually reaches buyers is where the real lessons live, especially for anyone trying to forecast what 2027 looks like.
What the Two Numbers Actually Measure
Before comparing anything, it helps to be blunt about what each figure represents, because they are not the same kind of animal.
The 125,000 figure is nameplate manufacturing capacity at Giga Texas, as disclosed in Tesla’s own annual filings. It describes a ceiling: the number of trucks the line could theoretically produce in a year under ideal conditions. Think of it as the size of the pipe, not the water flowing through it.
The 11,586 figure is a different beast entirely. It resembles third-party registration-based estimates that circulated during 2024 and 2025, typically built from vehicle registration data or VIN tracking. Tesla has never published Cybertruck-only sales in its quarterly reports; the company bundles the truck into a combined “Model S/X/Cybertruck” delivery category. So any Cybertruck-specific number comes from an estimator, not the manufacturer.
That distinction matters more than most people realize. Registrations lag production. They exclude unsold inventory sitting on lots. They depend on the estimator’s methodology, timing, and data sources. Comparing a capacity ceiling to a registration estimate is like comparing the seating capacity of a stadium to the number of tickets scanned at halftime.
| Dimension | 125,000 Capacity | 11,586 Sales Figure |
|---|---|---|
| Who publishes it | Tesla, in annual filings | Third-party estimators |
| What it describes | Theoretical maximum output | Estimated retail registrations |
| Time basis | Annual nameplate | Nine-month window |
| Includes unsold inventory | Yes, implicitly | No |
| Methodology transparency | Filed and auditable | Varies by estimator |
The comparison is not useless. It is just not an apples-to-apples efficiency score. It is a signal that production ramp and market absorption are moving at different speeds, and that the workflow connecting them has friction.
Why a Slow Ramp Is Not Automatically a Failure
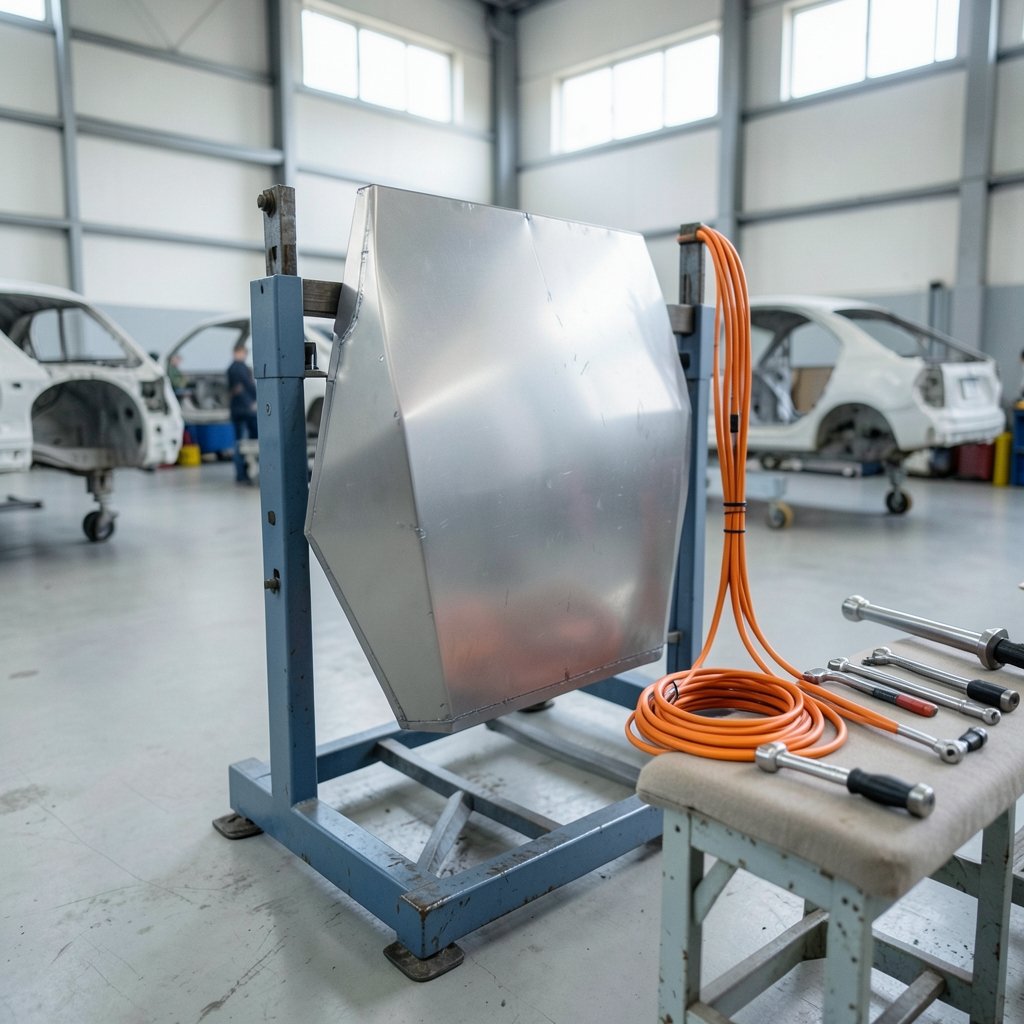
Tesla has repeatedly described the Cybertruck ramp as slow, citing manufacturing complexity. The stainless steel exoskeleton is not a normal body panel. The 48-volt architecture departs from the industry’s long-standing 12-volt standard. Steer-by-wire removes a mechanical link that has existed for over a century. Each of these is a workflow decision, and each one ripples through the entire production system.
Here is the practical insight that gets lost in headline shouting: a slow ramp is often a deliberate trade-off, not an accident. When you change the material, the electrical architecture, and the steering system at the same time, you inherit new failure modes at every station. Weld quality on stainless behaves differently than on stamped steel. Suppliers have to tool up for parts nobody has made before. Technicians need new training. Quality gates multiply.
Anyone who has watched a manufacturing line come online knows the pattern. You do not scale volume until yield stabilizes, because scaling a broken process just produces defects faster. The workflow difference to understand is sequencing: validate, stabilize, then accelerate. Skipping a step does not save time; it defers the cost.
The Supplier Ripple Effect
A truck with novel architecture forces suppliers into unfamiliar territory. A vendor that has spent twenty years making 12-volt harnesses now has to rethink gauge, connectors, and thermal behavior for a 48-volt system. That is not a purchase-order change; it is a workflow rebuild. Multiply it across hundreds of parts and you get a ramp that moves at the speed of the slowest supplier, not the fastest assembly robot.
The Workflow Differences That Will Define 2027
Projections for 2027 are speculative by nature. No official Tesla document lays out a 2027 Cybertruck capacity or sales target that can be verified. But the workflow patterns visible today give a reasonable basis for thinking about what has to change for the gap to close.
From Capacity Ceiling to Throughput Reality
Nameplate capacity is a promise. Throughput is performance. The distance between them is made of uptime, cycle time, and yield. A line rated at 125,000 units needs every station running near its design rate for the math to hold. In practice, new lines spend months below design rate while engineers chase bottlenecks.
The workflow lesson: track actual takt time against design takt time weekly. If the gap is not shrinking, the constraint has not been found yet. Most teams guess at the bottleneck; the ones who measure find it in a different place than they expected.
Inventory as a Signal, Not a Sin
When production outpaces registrations, trucks accumulate. Some of that is normal pipeline fill. Some of it is a warning. The workflow discipline is distinguishing between the two. Inventory that sits because of logistics is healthy; inventory that sits because dealers or showrooms cannot move it is a demand signal.
A practical habit that works: segment inventory by age and location. Trucks older than a set threshold in a specific region tell you something the aggregate number hides. Aggregate figures flatter; segmented figures tell the truth.
Service and Software as Part of the Product Workflow
The Cybertruck is a software-heavy vehicle, and that changes what “delivery” means. A truck is not finished when it leaves the line; it is finished when its software is current, its service network can support it, and its owner can get a repair without a months-long wait. Service capacity is a workflow constraint that rarely appears in production planning and always appears in customer satisfaction.
This is where comparisons to other tooling ecosystems become useful. Teams weighing platforms that promise speed often discover that the real cost sits in the handoffs, not the headline feature. The same logic that shapes Airtable vs Notion workflow differences applies to manufacturing software stacks: the tool matters less than how work moves between people. Likewise, engineers comparing development environments learn quickly that Kiro vs Cursor workflow differences come down to where friction hides in the daily loop.
Common Mistakes People Make When Reading These Numbers
Plenty of commentary goes wrong in predictable ways. Here are the traps worth avoiding.
Mistake one: treating a capacity figure as a production forecast. Capacity is what you could do. Forecast is what you plan to do. Actual is what you did. Three different numbers, three different owners.
Mistake two: comparing a nine-month estimate to a twelve-month ceiling without adjusting. The time bases do not match. Annualizing a nine-month registration estimate introduces its own error, and seasonality makes it worse.
Mistake three: assuming registrations equal demand. Registrations measure completed transactions in a jurisdiction. They miss pre-orders not yet delivered, vehicles in transit, and buyers who walked away. Demand is a survey concept; registrations are an administrative one.
Mistake four: ignoring the combined reporting category. Because Tesla folds Cybertruck into a broader delivery line, anyone quoting a precise Cybertruck-only sales number is relying on an estimate. That is fine as long as the estimate is labeled as such.
Mistake five: reading a slow ramp as a permanent verdict. Ramps bend. The interesting question is not where the curve is today but whether its slope is changing, and why.
What Actually Works in Practice
For analysts and enthusiasts alike, a few habits pay off. Pull the primary filings rather than secondhand summaries. Note the date on every estimate. Separate production, delivery, and registration into three columns and never blend them. And when a number lacks a named publisher and methodology, treat it as a rumor with a decimal point.
The same discipline shows up in technical comparisons. When people argue about RabbitMQ vs Kafka workflow differences, the useful analysis separates message semantics from throughput claims, because the two get conflated constantly. Data discipline is transferable across domains.
Where Profitability Fits In
Tesla’s shareholder communications and earnings calls have referenced Cybertruck profitability targets, with Musk stating in late 2024 that the truck had turned gross-margin positive. That claim sits alongside the slow-ramp narrative and is not contradictory. Early units carry high costs because tooling is amortized over few vehicles and rework rates are elevated. Margin improves as yield improves, which is another way of saying the workflow matures.
This is the part outsiders underestimate. A vehicle program’s economics are not set at launch; they are set by the slope of the learning curve. If defect rates fall and cycle times shrink, unit cost drops without a single price change. The 2027 question is really a question about how steep that curve turns out to be.
What 2027 Could Look Like
No verified official projection exists for 2027 Cybertruck output. What can be said is structural. Three forces will shape the outcome.
First, yield maturity. If the stainless exoskeleton and 48-volt systems settle into predictable production, throughput rises toward the nameplate ceiling. If not, the ceiling stays theoretical.
Second, market absorption. A truck priced in luxury territory competes in a narrower pool than a mass-market pickup. Registrations will reflect that pool’s size, not the factory’s ambition.
Third, service and software maturity. Owners who can get repairs quickly and updates reliably become repeat buyers and free marketing. Owners who cannot become cautionary tales.
The workflow differences to watch are therefore not dramatic. They are the unglamorous ones: takt time tracking, supplier readiness, inventory segmentation, service capacity planning. Programs rarely fail because of a single spectacular error. They drift because a dozen small handoffs were never designed.
Conclusion
The 125,000-versus-11,586 comparison is a useful provocation and a poor scorecard. One number is a filed capacity ceiling; the other is an unverified third-party estimate over a mismatched time window. Reading them as a single efficiency ratio confuses what a factory could build with what a market has absorbed.
What the gap does reveal is workflow. Novel materials, new electrical architecture, and unfamiliar steering systems create friction at every station and every supplier. Ramps that look slow from outside often reflect deliberate sequencing inside, where yield must stabilize before volume scales. The 2027 outlook depends less on a headline number than on whether takt times shrink, suppliers mature, inventory moves, and service keeps pace. Watch the handoffs, not the headlines.
FAQ
What does the 125,000 figure for the Cybertruck actually represent?
It represents Tesla’s stated annual nameplate manufacturing capacity for the Cybertruck at Giga Texas, as disclosed in the company’s annual filings. It is a theoretical maximum under ideal conditions, not a production forecast or a sales target.
Has Tesla ever published Cybertruck-only sales numbers?
No. Tesla reports a combined “Model S/X/Cybertruck” delivery category in its quarterly updates. Any Cybertruck-specific sales figure in circulation comes from third-party estimators using registration data or VIN tracking, and those estimates vary in methodology and accuracy.
Why can’t I directly compare 125,000 capacity to 11,586 sales?
Because they measure different things over different periods. Capacity is an annual manufacturing ceiling published by Tesla. The 11,586 figure resembles a nine-month registration-based estimate from a third party. Registrations lag production, exclude unsold inventory, and depend on the estimator’s methods.
Why has the Cybertruck production ramp been slow?
Tesla has cited manufacturing complexity, including the stainless steel exoskeleton, the 48-volt electrical architecture, and steer-by-wire steering. Each introduces new failure modes, supplier challenges, and training requirements, which forces a slower validation sequence before volume can scale.
Is a slow ramp a sign the program is failing?
Not necessarily. A slow ramp is often a deliberate trade-off: stabilize yield before scaling volume, because scaling a broken process produces defects faster. The meaningful signal is whether the ramp’s slope is improving over time, not where it sits on any given day.
What should I watch to judge the Cybertruck’s 2027 outlook?
Watch four workflow indicators: actual takt time versus design takt time, supplier readiness for novel parts, inventory age segmented by region, and service network capacity. No verified official 2027 projection exists, so these operational signals are more informative than headline sales estimates.