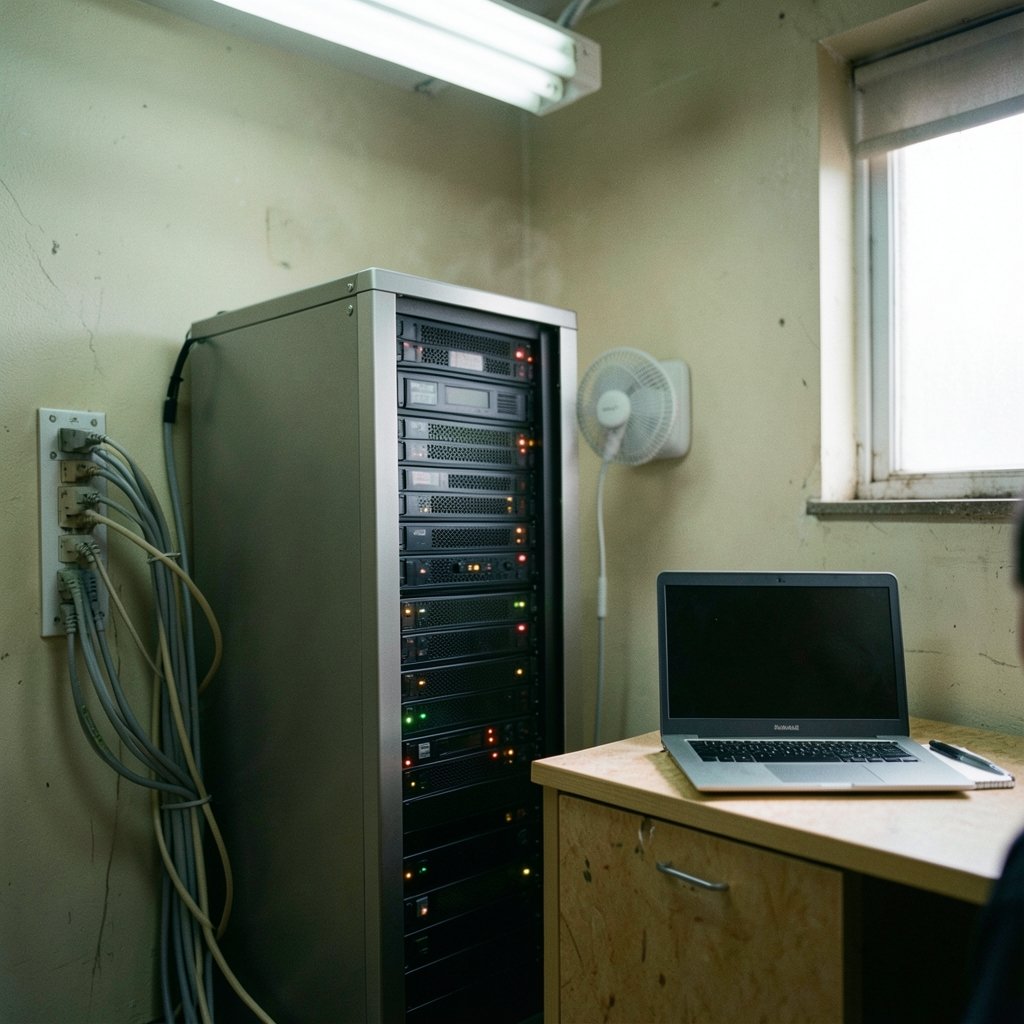
What happens when your checkout service slows to a crawl at 2 a.m. and nobody notices until customers start complaining on social media? That question sits at the heart of every infrastructure monitoring decision. The right tool catches the problem in seconds. The wrong one buries the signal under a pile of noisy alerts and a dashboard nobody trusts.
Choosing between monitoring platforms is harder than it looks. Vendors all promise “full observability,” and the feature lists start to blur together after the third demo. The trick is knowing which capabilities separate a tool that earns its place from one that becomes shelfware. This guide breaks down the specific features worth comparing, the ones that hide costs, and the mistakes teams make again and again.
Start With the Three Pillars, Then Go Deeper
Most comparison conversations begin with the three pillars: metrics, logs, and traces. It’s a useful starting taxonomy. Metrics are cheap to store and aggregate, logs carry high-volume detail, and traces show how a request flows across services. The real differences between tools show up in which pillars they handle natively versus through bolt-on integrations.
A platform that treats metrics as a first-class citizen but routes logs through a third-party plugin will behave very differently under load than one built for all three from day one. Before any demo, map your own environment: how many hosts, how many services, how much log volume per day, and whether you actually need distributed tracing yet. Teams that skip this step end up comparing features they’ll never use while ignoring the ones that matter daily.
OpenTelemetry Compatibility Is the New Baseline

OpenTelemetry (OTel) has become the vendor-neutral standard for collecting metrics, logs, and traces. It reached stable status for tracing and, later, for metrics, and its collection protocol (OTLP) is now the closest thing the industry has to a universal plug. For comparison purposes, this matters enormously: a tool that natively ingests OTLP lets you switch backends later without re-instrumenting every service.
Here’s a practical warning. Vendors love to claim “full OpenTelemetry support,” but that phrase can mean anything from native OTLP ingestion to a community plugin that handles a subset of signals. Check the vendor’s actual compatibility claims against the official OpenTelemetry registry rather than trusting marketing copy. The logs signal in particular has been maturing more slowly than metrics and traces, so verify the current status before you assume log coverage is complete.
If you’re still early in the tooling decision and weighing several categories at once, it helps to compare options systematically before committing budget. A structured approach, like the one behind this guide to comparing AI research tools before you subscribe, applies just as well to monitoring: list your requirements, score each candidate against them, and ignore features you can’t tie to a real workflow.
Metrics Collection: Prometheus Compatibility Still Counts
Prometheus is the de facto standard for metrics in cloud-native environments. It joined the Cloud Native Computing Foundation in 2016 and graduated in 2018, and its pull-based model, its PromQL query language, and its exposition format are now widely supported. That makes “Prometheus-compatible” a genuinely meaningful comparison criterion rather than a buzzword.
When you evaluate vendors, ask three specific questions. First, can the tool scrape Prometheus endpoints directly, or does everything need to route through an agent? Second, does it support PromQL, or does it force you into a proprietary query language that your team has to relearn? Third, how does it handle cardinality? High-cardinality labels, such as per-user or per-request identifiers, are one of the most common cost drivers in monitoring, and tools differ sharply in how gracefully they cope. Some silently drop data; others bill you for the explosion.
Pull versus push is another axis worth understanding. Pull-based collection suits stable, discoverable targets. Push-based collection fits short-lived jobs, serverless functions, and edge devices that can’t be scraped. A tool that only supports one model will eventually force an awkward workaround.
Logs: Volume, Search Speed, and the Cost Trap
Log aggregation is where budgets quietly die. Logs are high-volume by nature, and pricing models vary wildly: some tools charge by ingest volume, others by retention, others by indexed fields. A platform that looks cheap at 10 GB per day can become the single largest line item on your infrastructure bill at 500 GB per day.
Compare these log features directly:
| Feature | Why it matters | What to check |
|---|---|---|
| Ingestion pricing model | Drives long-term cost | Per GB ingested vs. per indexed field vs. flat tier |
| Retention flexibility | Balances cost and compliance | Can you keep 30 days hot and 1 year cold? |
| Query speed at scale | Determines daily usability | Test with your real volume, not a demo dataset |
| Structured parsing | Makes logs searchable | Native JSON parsing and field extraction |
| Sampling and filtering | Controls volume before billing | Can you drop noise at the agent level? |
That last row deserves emphasis. The cheapest log platform is the one you don’t have to feed. Tools that let you filter and sample at the collection layer, before data hits the billing meter, save far more money than tools with a slightly lower per-gigabyte rate.
Distributed Tracing and Request Flow
Traces answer the question metrics can’t: where did this specific request spend its time? The W3C Trace Context recommendation, published in November 2021, defines how trace IDs propagate across services, and tools that support it interoperate far better across vendors and across teams.
When comparing tracing features, look at sampling strategy first. Head-based sampling decides at the start of a request whether to record it, which is cheap but can miss rare errors. Tail-based sampling decides after the fact, capturing slow or failed requests but requiring more infrastructure. Many teams need both. Also check whether the tool supports context propagation across your messaging queues and async workloads, not just HTTP calls. Tracing that stops at the first queue is tracing with a blind spot.
Alerting and On-Call: A Separate Comparison Axis
Alerting is often lumped into “monitoring,” but it deserves its own evaluation. Alertmanager, the companion to Prometheus, handles deduplication, grouping, and routing of alerts. Many commercial platforms bundle alerting with full incident management, including escalation policies, on-call schedules, and status pages.
Compare these alerting features specifically:
- Alert routing: Can alerts go to different teams based on labels or severity?
- Deduplication and grouping: Will one failing database generate one alert or four hundred?
- Silences and maintenance windows: Can you mute expected noise without disabling real alerts?
- Escalation policies: What happens when the first responder doesn’t acknowledge?
- Alert quality tooling: Does the platform help you find alerts that fire constantly and get ignored?
That last point is underrated. Alert fatigue is a real operational risk, and a platform that surfaces noisy, low-value alerts helps teams fix them rather than just tolerate them.
SLOs and Error Budgets as First-Class Features
Service-level objectives (SLOs) and error budgets come from site reliability engineering practice, popularized by Google’s SRE book in 2016. Increasingly, monitoring tools compute SLOs natively rather than requiring you to build dashboards and queries by hand.
This is a genuine differentiator. A tool with native SLO support lets you define an objective, tracks the error budget burn rate automatically, and can alert when burn is faster than expected. A tool without it leaves you maintaining custom PromQL or dashboard logic that breaks whenever labels change. If your organization has started talking about reliability targets, native SLO support belongs on your comparison matrix.
Dashboards, Visualization, and the Grafana Question
Grafana is the common open-source visualization layer, supporting many data sources including Prometheus, Loki, and Elasticsearch. “Does it integrate with Grafana” is therefore a practical comparison criterion: a tool that plays nicely with Grafana lets your team keep one familiar interface across multiple backends.
But be careful about over-indexing on dashboards. A beautiful dashboard that nobody opens is decoration. Compare how quickly a new engineer can go from an alert to the relevant chart, and whether the tool supports linking from alerts directly into the relevant dashboard view. That workflow, alert to context in one click, matters far more than pixel-perfect graphs.
Retention, Cardinality, and the Total Cost Picture
Cost deserves its own section because it’s where comparisons most often go wrong. Vendors rarely publish detailed retention limits and cardinality caps, and pricing changes frequently, so treat any specific number you see as time-sensitive and verify it directly.
Build a simple three-year cost model before you sign anything. Include ingest volume growth, retention requirements, per-seat pricing for on-call users, and the engineering time needed to maintain agents and pipelines. That last item is real money. A self-hosted stack with “free” software can cost more in engineer hours than a managed service, while a managed service can quietly become expensive as volume grows. The honest comparison is total cost of ownership, not sticker price.
This same discipline applies across tool categories. Teams that carefully evaluate infrastructure choices often apply the same rigor elsewhere, whether that’s comparing AI writing tools before subscribing or reviewing cloud infrastructure tools that actually earn their place. The principle holds: score against real requirements, then decide.
Common Mistakes Teams Make
A few patterns show up repeatedly in monitoring tool selections.
Buying for the demo, not the workload. Vendors demo with tidy datasets. Ask for a proof of concept against your own volume and your own messiest service.
Ignoring the migration cost. Switching backends means re-instrumenting, retraining, and rewriting dashboards. OTel compatibility reduces this risk, which is exactly why it belongs near the top of your criteria.
Over-alerting on symptoms. Teams often alert on CPU and memory because those metrics are easy, while the metrics that predict user pain get neglected. Compare tools on how well they support symptom-based alerting.
Skipping the query language question. If your team already knows PromQL, a proprietary query language is a hidden training cost. If they don’t, a simpler interface may win.
Forgetting about the humans. On-call rotation features, mobile alerting, and escalation clarity affect quality of life more than any single metric feature.
Conclusion
Comparing infrastructure monitoring tools comes down to matching features to your actual environment rather than chasing the longest feature list. Prioritize native OpenTelemetry ingestion so you keep your options open. Verify Prometheus compatibility and understand how each tool handles cardinality. Model log costs at your real volume, not the demo volume. Treat alerting and SLO support as separate evaluation axes, because they solve different problems than data collection does. And always calculate total cost of ownership, including the engineering hours that never appear on an invoice.
The teams that get this right tend to be the ones that wrote down their requirements before the first demo. Do that, score honestly, and the choice becomes much clearer.
What are the three pillars of observability?
The three pillars are metrics, logs, and traces. Metrics are numeric measurements that are cheap to store and aggregate. Logs are detailed, high-volume event records. Traces follow a single request as it moves across services. Tools differ mainly in which pillars they handle natively versus through integrations, so compare coverage pillar by pillar rather than accepting a general “full observability” claim.
Why does OpenTelemetry compatibility matter when comparing tools?
OpenTelemetry is a vendor-neutral standard for collecting metrics, logs, and traces, and its OTLP protocol lets tools ingest telemetry without proprietary agents. If a platform supports native OTLP ingestion, you can change backends later without re-instrumenting every service. That flexibility has real value, so verify claims against the official OpenTelemetry registry rather than vendor marketing pages.
Is Prometheus compatibility still a useful comparison criterion?
Yes. Prometheus is the de facto standard for metrics in cloud-native environments, and its pull model, PromQL query language, and exposition format are widely supported. When comparing tools, check whether they scrape Prometheus endpoints directly, whether they support PromQL, and how they handle high-cardinality labels, which are a common hidden cost driver.
What is cardinality, and why does it affect cost?
Cardinality refers to the number of unique label combinations in your metrics. Labels like user ID or request ID can create enormous numbers of unique series, and many platforms bill or throttle based on that volume. Tools handle this differently: some drop excess data, others charge for it. Ask each vendor directly how cardinality limits work before you commit.
Should alerting be evaluated separately from monitoring?
Yes. Alerting has its own feature set: routing, deduplication, grouping, silences, maintenance windows, and escalation policies. A platform can collect excellent data and still produce unusable alerts. Compare how each tool groups related alerts, whether it supports on-call schedules, and whether it helps you identify noisy alerts that teams have learned to ignore.
How should a team model monitoring costs before choosing a tool?
Build a simple multi-year model that includes ingest volume growth, retention requirements, per-user pricing for on-call staff, and the engineering time to maintain agents and pipelines. Vendors rarely publish detailed limits publicly, and pricing changes often, so verify current terms directly. Total cost of ownership, not sticker price, is the honest basis for comparison.