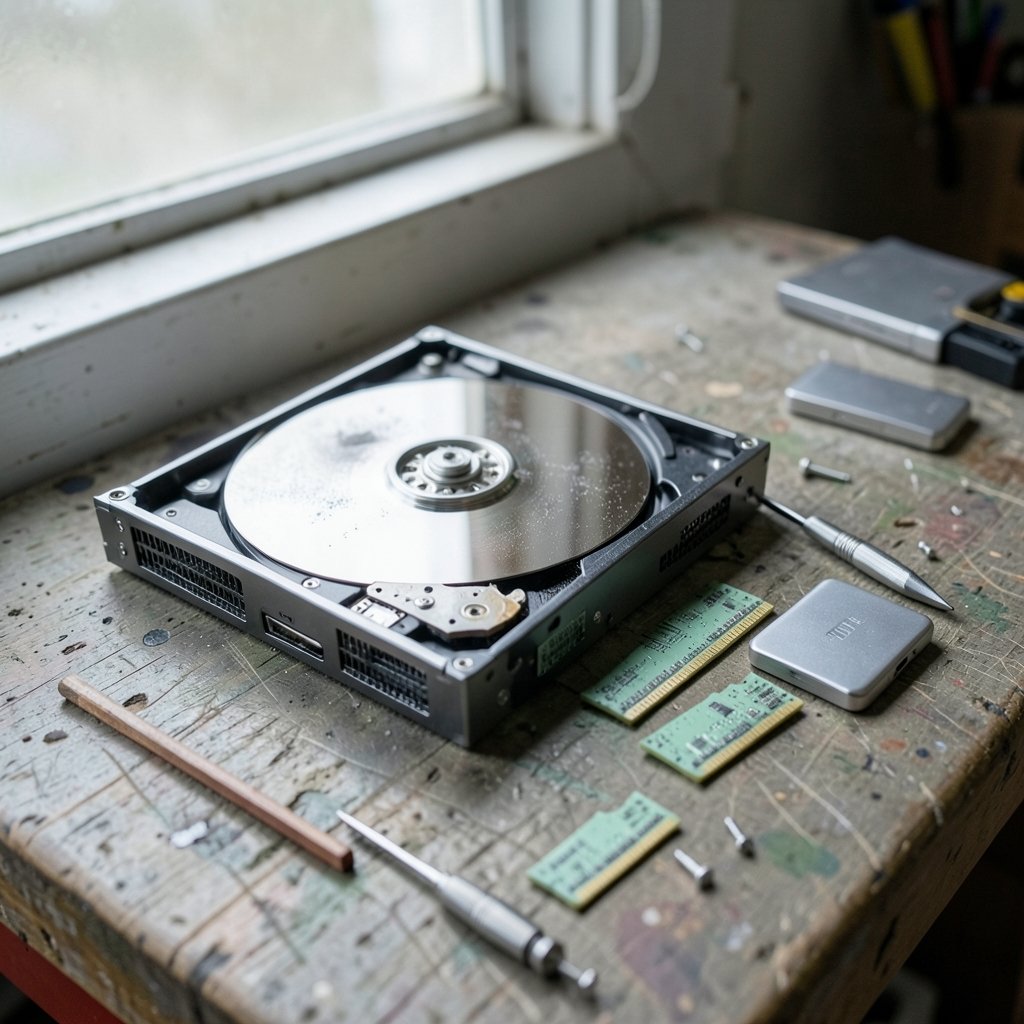
Quick Answer: How Long Do Components Last in 2027? Real Failure Data?
There is no single lifespan for computer components in 2027. The honest answer is a range: RAM can run for decades, SSDs typically last five to ten years of normal use, and hard drives often fail somewhere between three and six years, depending on workload and heat. What makes 2027 different is that companies are now deliberately stretching hardware past its design life because replacement parts are scarce.
The clearest example comes from Meta, which extended the service life of some non-AI data center servers from six years to seven. That single year of extra runtime is expected to push the annual failure rate from 4.8% to 7.4%. Push the same equipment to eight years, and internal analysis reportedly found the failure rate too high to be workable.
Before planning a refresh, compare the component type, its duty cycle, the operating temperature, the warranty terms, and whether spares are actually available, because in 2027 availability may matter more than the calendar.
Why 2027 Is a Strange Year for Hardware Lifespans
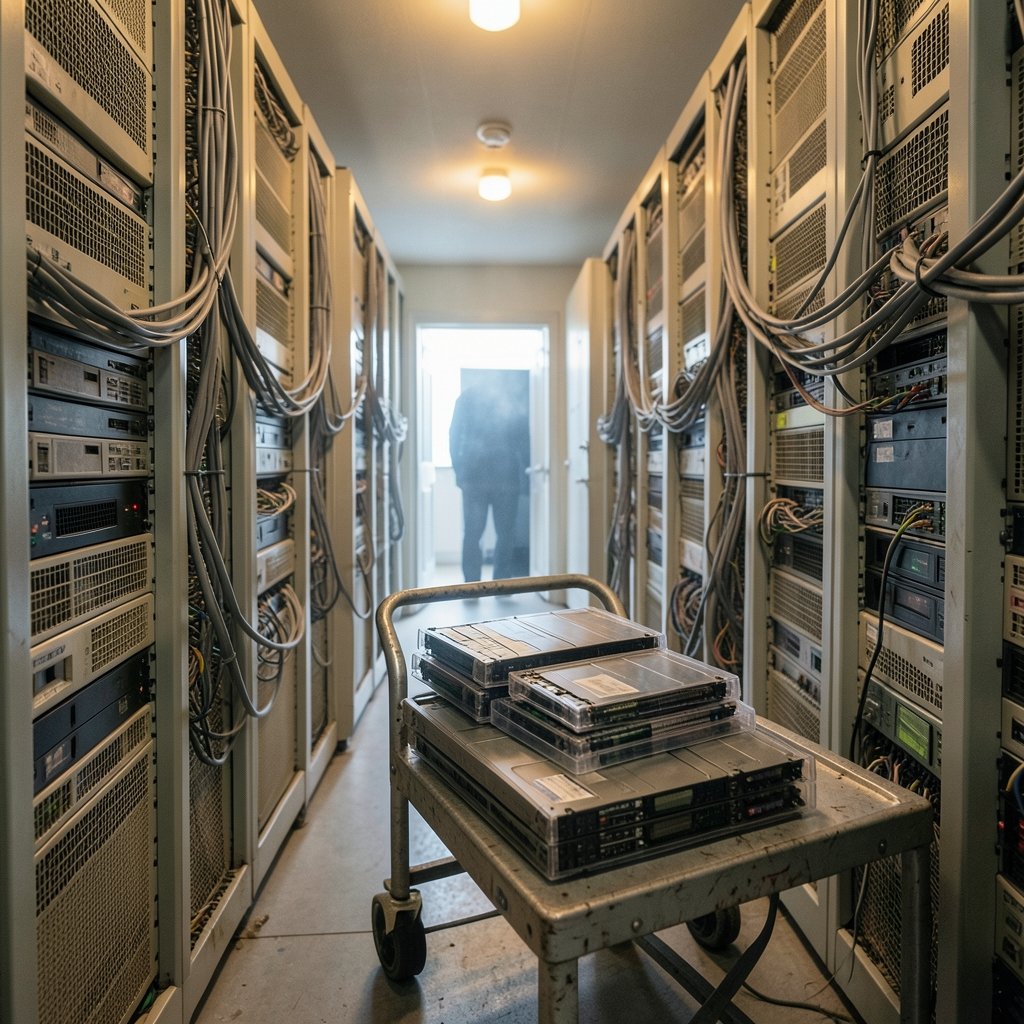
Ask most IT managers how long a server lasts and you will get a tidy answer: five years, maybe six. Ask them in 2027 and the answer gets messier. A memory chip shortage has reshaped the math, and it has nothing to do with how well the hardware was built.
Meta’s internal memos, reported in April 2026, described a “significant server supply deficit” affecting non-AI servers and expected to run through 2027. The binding constraints were named specifically: DRAM and hard disk drives. New procurement could not keep pace with demand growth, so the company chose to keep existing machines in service longer.
The numbers behind that decision are the most useful public failure data point available. Extending server life from six to seven years lifts the annual failure rate from 4.8% to 7.4%. That is roughly a 54% relative increase in failures per year, for one extra year of service. Meta reportedly considered eight years and rejected it as too failure-prone.
The wider context explains the squeeze. Data centers alone were projected to consume 70% of memory chips made in 2026, and manufacturing capacity for 2028 was already being sold. When AI builders pay premiums for components, everything else gets pushed down the queue, including ordinary PCs, phones, and non-AI servers.
What Real Failure Curves Actually Look Like
Component failures do not follow a neat schedule. They follow a shape, and that shape matters more than any single average.
The bathtub curve, without the marketing
Most electronics show three phases. Early failures, sometimes called infant mortality, cluster in the first weeks and usually reflect manufacturing defects. Then comes a long stretch of relatively stable, random failures. Finally, wear-out begins as physical degradation accumulates.
The middle phase is where averages mislead. Random failures are often modeled with an exponential distribution, where the failure rate stays roughly constant and past survival tells you little about future risk. A component that has run flawlessly for four years is not “due” to fail, and it is not safe either. It simply sits at the same per-hour risk as before.
For components with extremely low failure rates, manufacturers estimate mean time to failure through accelerated aging tests rather than waiting decades for real data. That means published MTTF figures are statistical projections, not observations of your specific unit.
Why averages hide the outliers
A memory module can die in its first year or run for forty. One documented case involved a RAM stick still working perfectly since 1985, which says more about the durability of solid-state parts with no moving pieces than about any guarantee. RAM has no fans, no platters, no spinning bearings, so its failure modes are mostly electrical and thermal rather than mechanical.
The practical lesson: treat any single lifespan number as a planning assumption, not a promise. If you want to see how failure data behaves over time rather than as a single average, the way a strip chart plots time series data is a useful mental model for spotting real signals against noise.
Component-by-Component: What to Expect
| Component | Typical real-world life | Main failure driver | 2027 supply note |
|---|---|---|---|
| RAM (DIMM) | 10+ years, sometimes decades | Heat, voltage, handling damage | Severe shortage; DRAM named as a binding constraint |
| SSD (NVMe/SATA) | 5–10 years of normal use | Write endurance, controller failure | Tight; NAND prioritized for AI |
| Hard drive (HDD) | 3–6 years typical | Mechanical wear, vibration, heat | Named alongside DRAM as scarce |
| Server (whole unit) | 6 years standard, 7 under pressure | Mixed; rises with age | Extended life now common |
| Laptop | 4–6 years of daily use | Battery, hinges, thermal wear | Prices rising on some business models |
| GPU | 4–7 years | Fan bearings, thermal paste, VRMs | Constrained by memory supply |
Two rows deserve emphasis. First, RAM is the marathon runner of the bunch. Second, hard drives are the opposite: they are the component most likely to strand your data, which is why backup discipline beats lifespan guessing every time.
If you are weighing a laptop purchase against a repair, the realistic lifespan of the machine itself is worth studying before you spend, and this breakdown of how long MacBooks realistically last and what kills them covers the wear points that actually matter.
The Economics of Stretching Hardware to Seven Years
Keeping a server one extra year sounds like a rounding error. It is not.
Meta’s own projection shows the trade plainly. Going from six to seven years raises the annual failure rate by 2.6 percentage points. For a fleet of thousands of machines, that is a lot of replacement parts, service tickets, and redundancy checks. The company framed it as an operational adjustment affecting only a small portion of equipment, backed by failover and protection mechanisms, with no expected impact on service reliability.
That framing is the template for anyone else considering the same move. Extended life only works when three conditions hold: you have spare capacity to absorb failures, you have monitoring that catches degradation early, and you have a realistic spare-parts pipeline. Lose any one of those and the saved capital gets eaten by downtime.
The environmental angle is real too. Life cycle emissions per unit per year of use fall as a device stays in service longer, because the manufacturing burden is spread across more years. A notebook in business-as-usual use carries roughly 55.6 kg CO2e per unit per year, and stretching service life reduces that annual figure. Repairability and operating-system support policies shift it further.
For anyone running the same calculation on personal finances, the same logic applies: the cheapest machine is often the one you already own, provided the repair cost stays below replacement value. This walkthrough of how long your money will last with a realistic way to run the numbers uses the same kind of projection.
What Actually Kills Components in Practice
Most premature failures are not mysteries. They are predictable, and they are usually self-inflicted.
Heat and dust
Every 10°C of sustained extra temperature roughly doubles many chemical degradation rates. Dust-clogged heatsinks are the single most common cause of avoidable death in desktops, laptops, and servers alike. A can of compressed air costs less than a new drive.
Power quality
Cheap power supplies and unstable mains voltage quietly damage capacitors and storage controllers. A decent surge protector is not glamorous, but it is cheaper than data recovery.
Vibration and movement
Hard drives hate being bumped while spinning. Laptops that travel in bags that get tossed around accumulate head crashes. Solid-state drives shrug this off, which is one reason they have displaced spinning disks in portable machines.
Write endurance on SSDs
Consumer SSDs handle hundreds of terabytes written before wear becomes a concern. The controller usually fails before the flash cells do. Monitoring tools that report drive health and remaining endurance are worth the five minutes they take to install.
The mistake almost everyone makes
People replace hardware when it feels slow rather than when it is failing. A five-year-old laptop with a failing hard drive and 8GB of RAM gets replaced entirely, when a new SSD and more memory would buy three more years. The reverse mistake is just as common: nursing a machine that has already lost vendor support and cannot receive security patches.
Planning a Refresh Cycle That Survives 2027
The shortage changes the calculus, but it does not erase good practice. A defensible plan looks like this:
- Inventory every device with its age, warranty status, and role.
- Flag anything past vendor support or out of security updates, and treat those as mandatory replacements.
- Identify devices where a cheap upgrade, such as storage or memory, buys two or more years.
- Check spare-parts availability before committing to extended life, since DRAM and HDDs are the constrained items.
- Set failure thresholds in advance, so a rising failure rate triggers replacement rather than debate.
The last point is where Meta’s approach is instructive. The company quantified the failure-rate penalty before extending life, not after. If you cannot state what failure rate you are willing to tolerate, you are not planning, you are hoping.
Data strategy matters here too. If your workloads are moving to managed platforms, the lifespan of your own hardware matters less. A look at real cloud data warehouse platforms and how they differ shows how much of the refresh burden can be shifted to a provider, at a cost.
Security deserves a mention as well. Older hardware running older software is a bigger risk than older hardware alone, and encryption is one control that keeps working on aging machines. These data encryption tools that fit small business budgets are worth pairing with any extended-life plan.
How to Read Failure Data Without Being Fooled
Vendors publish annualized failure rates, MTTF figures, and endurance ratings. All three are useful and all three get misread.
An annualized failure rate of 1% does not mean one in a hundred units dies each year like clockwork. It means that across a large fleet, roughly that share fails per year on average, with clustering. A batch of drives from a bad production run can blow past that number, which is why batch-level tracking beats model-level averages.
Simulation studies of system end-of-life show the same lesson at the system level. In one analysis of a legacy system, 22 of 70 cards experienced a first end-of-manufacture date before 2050, and the probability of at least one instance being unsupportable by 2028.52 was about 50%. Averages across a whole system hide the fact that a handful of parts drive most of the risk.
The takeaway for 2027: track your own fleet. Your failure data is more relevant to your decisions than any published average, and it is the only dataset that includes your power quality, your dust, and your users.
Conclusion
Component lifespans in 2027 are less about physics than about arithmetic under constraint. RAM will outlast almost everything around it. SSDs and hard drives will fail on their own schedules, with spinning disks leading the pack. Servers that once retired at six years are now being pushed to seven, and the price of that extra year is a failure rate climbing from 4.8% to 7.4%.
The practical response is not to memorize a table of lifespans. It is to know your own fleet, keep heat and dust under control, upgrade before you replace, and decide in advance how much failure you are willing to absorb. Shortages reward the people who planned for them and punish the ones who assumed the supply chain would behave.
FAQ
Do components fail more often in their first year or after several years?
Both ends carry risk, for different reasons. Early failures usually trace back to manufacturing defects and show up within weeks. After that, failures are largely random until wear-out sets in. The middle years are the safest, which is why a machine that has run cleanly for two years is a reasonable bet for several more.
Is it safe to keep a server running for seven years instead of six?
It can be, if you accept the numbers. Extending life from six to seven years raises the annual failure rate from 4.8% to 7.4%, so the machine needs redundancy, monitoring, and spare parts behind it. Without those, the savings tend to disappear into downtime.
Which component is most likely to fail first in a typical desktop?
Hard drives and cooling fans, in most cases. Both have moving parts, and both degrade with heat and dust. Memory and processors usually outlast everything else in the case, which is why a storage upgrade often revives an otherwise healthy machine.
Does RAM actually wear out?
Slowly, and rarely. Memory modules have no moving parts and often run for a decade or more. Failures tend to come from heat, voltage problems, or physical handling rather than gradual wear. A module that has worked for years is not automatically at higher risk next year.
Why are components harder to buy in 2027?
Memory and storage capacity is being prioritized for AI infrastructure, which pays a premium. Data centers were expected to absorb 70% of memory chips made in 2026, and capacity for 2028 was already being sold. That leaves less DRAM and fewer hard drives for everyone else, including ordinary businesses.
Should I replace a slow computer or upgrade it?
Check what is actually slow. If the drive is the bottleneck, a new SSD is usually the cheapest fix and can add years of usable life. If the machine has lost security updates or the repair costs more than a replacement, replace it. The label “old” is not a diagnosis.