
A live stock quote is a starting point, not a complete picture of what owning a company means. Apple trades in the United States under the ticker symbol AAPL, and its price changes during trading. The Apple share price can help investors track a position, but it cannot show the full business outlook.
A quote answers what a share costs at a given time. Historical performance helps show how the price changed, while analyst expectations offer estimates about possible future value. Those expectations are not promises, and a recent price alone does not show whether a stock fits your plans.
Apple’s technology, products, and services can shape its results, but market prices also respond to wider events. A date matters when you compare numbers. Use a dated closing price when comparing the quote with another day’s market data.
Key Takeaways
- Apple trades on Nasdaq under the ticker symbol AAPL.
- A live quote, a closing price, and an analyst estimate answer different questions.
- Apple’s business includes devices and services.
- Stock splits affect per-share comparisons across dates.
- Analyst targets are estimates, not guaranteed future prices.
Apple Share Price Today: Quote, Range, and Market Context
Apple closed at $344.05 on October 28, 2026, with that closing figure distinct from the day’s trading range. The close was below the previous session’s $347.10 close. Apple Inc. trades on Nasdaq under the ticker AAPL, and U.S. quotes use U.S. dollars.
The October 28 intraday range was $343.90-$347.18. The 52-week high was $351.73, and the 52-week low was $243.42 in October 2026. A closing price records the final price for the session, while the range captures prices traded during that day.
Apple shares are listed on Nasdaq, not India’s NSE, so an NSE quote is not the U.S. listing. A market capitalization is the total market value of a company’s outstanding shares, calculated by multiplying its share price by the number of shares outstanding. That value changes when the share price changes.
Financial Times’ Apple Inc. market summary shows delayed quote data and company statistics. Prices may be delayed at least 15 minutes, so a displayed quote can differ from a live trading price.
Check the market date and whether a displayed number is a live quote or a closing price before comparing it.
That distinction matters when comparing securities traded on different exchanges or in different currencies. A date beside a quote tells you which market session the number describes. Check the market date and whether a displayed number is a live quote or a closing price before comparing it.

How Apple Makes Money Across Products and Services
Apple’s business combines devices people buy with services they use across its product ecosystem. Hardware sales and recurring services both help shape Apple Inc.’s results. Investors can look beyond the stock quote to see which products and services support the company’s earnings.
Apple reported Q3 FY26 revenue of $109.42 billion and earnings of $29.79 billion. Those results describe one completed quarter, not a promise about future sales. Apple’s official 2024 Form 10-K describes its product lines and services.
Hardware Anchored by iPhone
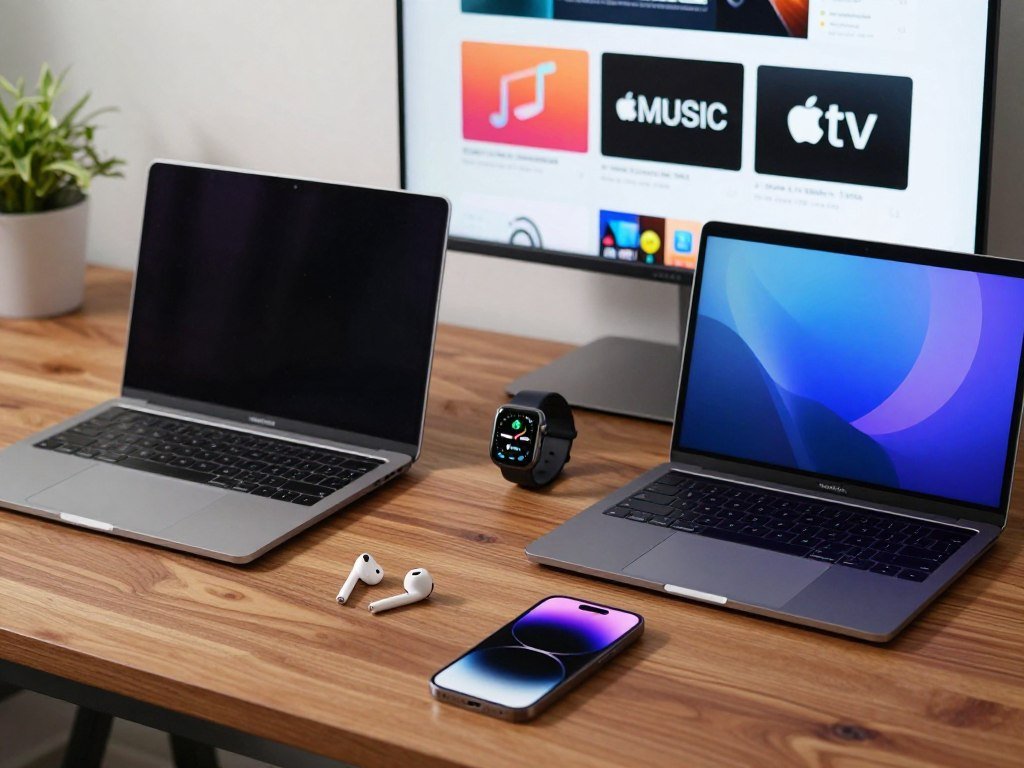
The iPhone is Apple’s main smartphone line, while Mac computers serve home, school, and work needs. A MacBook Pro is one example of its personal computers. Readers comparing add-ons can review this MacBook Pro USB-C hub guide for port and display details.
Apple also sells iPad tablets, wearables, home products, and accessories. These devices extend the company’s hardware range beyond smartphones and computers. Each line serves a different use, from mobile work to health tracking and home entertainment.
- iPhone
- Mac and personal computers
- iPad and tablets
- Wearables, home, and accessories
- Services
Services Around Apple Devices
Services include App Store distribution, AppleCare, cloud services, advertising, payment services, and subscriptions. These offerings connect with Apple devices, though customers may use different services in different ways. Apple Intelligence is also built into operating systems for iPhone, Mac, and iPad.
Sales from hardware and services can change with demand, product cycles, and customer choices. A strong quarter can reflect several business lines, rather than one device alone. Read a single quarter’s revenue and earnings as a snapshot, then consider whether later results sustain the business trends you care about.
What Apple’s Price History Looks Like After Stock Splits
A stock split changes the number of shares and the per-share price, not the underlying value of an investor’s ownership by itself. Split-adjusted prices help compare different dates on a consistent share basis. That adjustment can make older prices look very different from the prices originally quoted at the time.
A split-adjusted price is a past price recalculated to account for later splits. It lets you compare price performance as if the share units had stayed consistent. A real price is the share price recorded at that time, before later split adjustments.
Why Split-Adjusted Prices Differ
Apple completed 2-for-1 splits in 1987, 2000, and 2005. The company later completed a 7-for-1 split in 2014 and a 4-for-1 split in August 2020. A 4-for-1 split turns each old share into four shares, while dividing the per-share price by four.
For example, a person holding one share before a split would own more shares after it. The ownership percentage does not change from the split alone because all shareholders receive the same proportional adjustment. The company’s total value does not rise just because its share count increases.
Apple’s 2007 and 2024 Price Points
Apple’s split history changes how its older price points appear in a long-term chart. Alpha Spread’s Apple stock split history lists the earlier 2-for-1 splits and later split ratios.
| Month | Split-adjusted price | Real price |
|---|---|---|
| January 2007 | $2.56 | $85.73 |
| December 2007 | $5.92 | $198.08 |
| January 2024 | $182.18 | $184.40 |
| December 2024 | $248.62 | $250.42 |
| October 2026 | $344.70 | $344.70 |
The gap between adjusted and real prices is largest when more later splits affect the older share unit. By October 2026, the monthly adjusted and real prices were both $344.70. Compare historical prices on the same split-adjusted basis to avoid mistaking a change in share units for investment performance.
Apple’s historical adjusted prices show how those figures differ across dates.
How to Read Apple’s Stock Chart and Trading Signals
A chart indicator describes past price behavior; it does not guarantee the next move. Moving averages smooth price data over a chosen period. In October 2026, Apple’s 50-day moving average was $331.06, and its 200-day moving average was $295.28.
The 50-day average covers a shorter period, so it can react faster to recent price moves. The 200-day average includes more trading days and changes more slowly. Neither measure can tell you what the stock will do tomorrow.
Beta measures how a stock has moved relative to a broader market over a set period. Apple’s 5-year monthly beta was 1.07 in October 2026. It describes historical movement, not the size or direction of the next price change.
Before reading a chart, use this three-step checklist:
- Identify the chart’s date range.
- Check whether it shows adjusted or unadjusted prices.
- Compare the stock’s move with an appropriate market benchmark.
Stock charts can also display volume, which counts shares traded during a period. High or low volume may add context to a price move, but it does not settle what caused that move. Choose a benchmark that matches the question, such as a broad U.S. stock index for general market comparison.
Short-term signals can change as new trading days add data and older days drop out of a moving average. A sharp move can affect a short average more than a long one. Confirm the chart’s time window before using a moving average to assess a short-term move.
What Apple’s Share Count and Market Cap Reveal
Share count adds context to a quote because the price of one share does not show the whole company’s market value. Apple had 14,656,110,000 shares outstanding in October 2026. Its market capitalization was $5.07 trillion that month.
Market capitalization estimates the market value of all outstanding shares. It differs from revenue, which counts money earned from business activity, and from the price of one share. A company can have a low share price and a large market capitalization if it has many shares outstanding.
Apple had 15.50 billion shares outstanding at the end of 2023. The count was 15.08 billion at the end of 2024 and 14.74 billion at the end of 2025. The October 2026 count was lower than each of those year-end figures.
A company can reduce its outstanding shares through buybacks. A stock split changes the share count and per-share price mechanically, but the figures above alone do not explain why Apple’s count changed. The reporting date and share-count definition matter when comparing companies or years.
Share count can affect per-share measures, including earnings per share, because earnings are divided across outstanding shares. A buyback may change that calculation, but it does not by itself prove that the business has grown. Company results and share count answer different questions about scale.
Before comparing Apple with other companies, check whether each figure counts basic or diluted shares. Those measures can differ because diluted counts include certain potential shares. Compare share counts using the same reporting date and definition before drawing a trend.
What Analysts Expect From Apple Stock in 2026
The October 2026 analyst outlook spans $245.00 to $400.00, with a $340.59 average 12-month target. The range reflects 43 analyst forecasts, not a guaranteed year-end price. An Apple share price prediction is an estimate, and it cannot say where the stock will trade tomorrow.
Analysts may use different assumptions about sales, earnings, competition, and market conditions. The average combines their estimates, but it does not remove the uncertainty behind each forecast. Actual results can differ from those expectations.
Price Targets Are Estimates, Not Promises
The October 2026 average 12-month target was $340.59. The high estimate was $400.00, and the low estimate was $245.00, based on 43 analysts’ forecasts. A 12-month target looks ahead from the estimate date, rather than naming a set year-end price.
Readers looking for an Apple stock price prediction for tomorrow cannot use a 12-month target as a daily forecast. Analysts revise targets when their views or business assumptions change. The spread between the high and low estimates also shows that analysts do not share one exact view.
What the Rating Mix Shows
Apple’s October 2026 analyst consensus was Moderate Buy, based on 43 ratings. The breakdown included 2 sell, 15 hold, 25 buy, and 1 strong buy rating. A consensus rating summarizes opinions; it is not a personal recommendation for your investment.
The trailing P/E ratio was 39.81, and the forward P/E ratio was 36.16 in October 2026. A P/E ratio compares a share price with earnings per share. The trailing measure uses past earnings, while the forward measure uses estimated future earnings.
Analyst views can shift after new earnings, product news, or changes in market conditions. Estimates also depend on assumptions that may not hold. Treat a target as one input, and check whether the assumptions behind it still fit your own view of Apple’s earnings and risks.
October 2026 analyst targets and ratings capture the estimates and rating mix for that period.
What Apple’s Dividend Pays and When
Apple pays a cash dividend, but its October 2026 forward yield was 0.31%. The forward annual dividend rate was $1.08 per share. Apple’s trailing 12-month dividend yield was also 0.31% in 2026.
Yield compares annual dividend payments with a share’s price. It can rise or fall when the share price changes, even if the dividend stays the same. Apple’s 2026 payout ratio was 12.04%, which compares dividends with earnings.
Apple declared three cash dividends listed for 2026. Each payment has an ex-dividend date and a payable date, which mark separate stages. The table gives the per-share amount and both dates.
| Cash dividend per share | Ex-dividend date | Payable date |
|---|---|---|
| $0.2600 | February 9, 2026 | February 12, 2026 |
| $0.2700 | May 11, 2026 | May 14, 2026 |
| $0.2700 | August 10, 2026 | August 13, 2026 |
The ex-dividend date determines whether a share purchase qualifies for the declared payment. The payable date is when the company schedules the cash distribution. Financial Times lists Apple’s annual dividend rate and yield with market statistics.
A dividend can change, and a past payment does not guarantee future payments at the same level. A 0.31% forward yield is not a high yield, so investors focused on income may weigh it alongside other factors. Check the ex-dividend date and payable date separately because they mark different parts of a dividend payment.
What Could Change Apple’s Outlook?
Whether Apple belongs in a portfolio depends on your goals, time horizon, and ability to tolerate a loss, not just the latest quote. A single-company holding carries company-specific risk. Product demand, earnings, consumer preferences, competition, and broad market conditions can all affect the outlook.
Apple’s future results may differ from what investors expect. Competition can pressure sales, while changes in customer choices may affect demand for products and services. Legal or product issues may also draw attention; reports of early iPhone Duo screen damage, for example, have not established a cause or failure rate.
Before making a decision, review three factors:
- Your investment time horizon.
- Portfolio concentration and ability to absorb a loss.
- Apple’s future results compared with expectations.
Apple’s trailing total returns as of October 28, 2026, may include dividends or other distributions. The stated benchmark is the S&P 500. Check whether a comparison uses price return or total return, since total return can include distributions.
Investors can also consider whether one company holds too much weight in a portfolio. A concentrated position may be more exposed to company-specific news than a broader mix of holdings. Review the position size against your broader portfolio before deciding whether to add, hold, or reduce shares.
Review the position size against your broader portfolio before deciding whether to add, hold, or reduce shares.
The App Store fee dispute is one example of a business issue that may affect Apple’s risks and competition.
Reported iPhone Duo screen damage is another example of product-specific uncertainty.
Conclusion
Apple’s share price is only one piece of an investment decision. A stock quote is tied to a specific market date, and an analyst estimate is not a promise. Business results and personal goals give those numbers meaning.
A practical next step is to check the latest dated quote and Apple’s company results. Then compare the position with your own goals, time horizon, and risk tolerance. That review can help you decide what information matters most to your plan.
A price can change within a trading session, while company results arrive on a different schedule. Keep the dates beside both figures when weighing them. Before placing a trade, make sure the latest quote and your own investment plan still agree.
FAQ
Is Apple share a buy?
No single answer fits every investor; the choice depends on goals, valuation, company-specific risk, and portfolio concentration. Apple’s Moderate Buy consensus summarizes analyst ratings, not a personal recommendation. Consider how much of your portfolio already depends on one company and whether you can tolerate a loss. A favorable rating does not ensure future gains or remove the chance of a price decline.
How to earn $500 a month from Apple stock?
To target $500 a month from dividends, start with $6,000 over 12 months before taxes. Divide that annual goal by Apple’s current annual dividend per share to estimate the required share count. The October 2026 forward annual rate was $1.08 per share, but dividends can change. The share price can also move, so this calculation does not guarantee income or protect the value of the shares.
Why is Apple stock AAPL and not Apple?
AAPL is Apple’s Nasdaq ticker symbol, used to identify the listed shares in market quotes and trades. A company name can differ from its ticker because exchanges use short symbols to distinguish securities. Search results and trading screens may show both Apple Inc. and AAPL. The ticker identifies the listed shares, while the company name identifies the business behind them.
Does Apple pay dividends?
Yes, Apple pays dividends, and its October 2026 forward annual rate was $1.08 per share. Its forward yield at that time was 0.31%, based on the share price. The yield can change as the price moves, even if the payment stays the same. Apple may also change future dividend amounts, so past payments do not guarantee a fixed income stream.
Will Apple split in 2026?
No one can predict a future split from Apple’s past schedule alone. Apple’s latest split was 4-for-1 in August 2020, and a new split would require a company announcement. A split changes the number of shares and the per-share price, but does not by itself change each investor’s ownership percentage. The company’s prior split dates do not set a timetable for another one.
Is Apple a good dividend stock to buy?
Apple’s October 2026 forward yield was 0.31%, so the dividend may matter less to investors seeking high current income. Consider your income needs, the chance of dividend changes, and share-price risk rather than yield alone. A dividend does not prevent a stock from falling in value. You can also compare the cash payment with other parts of the company’s results.
Should I keep or sell my Apple stock?
Review your time horizon, portfolio concentration, and tolerance for loss before deciding whether to keep or sell. Ask whether Apple’s future results still support the reasons you bought the shares. Your goals may change, and a position that once fit may no longer match your plan. Analyst ratings can offer context, but they cannot make that personal choice for you.
How high will Apple go in 2026?
No analyst target can guarantee how high Apple will trade during 2026. In October 2026, analysts’ 12-month targets averaged $340.59 and ranged from $245.00 to $400.00. Those estimates were based on 43 forecasts and could change with new information. They do not promise a year-end price, and they do not predict tomorrow’s market move.