
A self-driving car has roughly 100 milliseconds to spot a child stepping into the road and react. A factory robot arm has even less time to halt before a collision. These aren’t hypotheticals; they’re the reason edge computing exists. When a round trip to a distant data center takes 50 to 100 milliseconds or more, processing data closer to where it’s created isn’t a luxury. It’s a requirement. But how do you actually know your edge deployment is working? That’s where edge computing metrics come in, and getting them right is harder than it sounds.
Why Edge Metrics Are Different from Cloud Metrics
Cloud monitoring is a well-trodden path. You watch CPU, memory, network throughput, and error rates, and you’ve covered most of the ground. Edge computing throws several wrenches into that model.
First, the infrastructure is fragmented. Instead of a handful of large data centers, you’re managing hundreds or thousands of small nodes spread across cell towers, retail stores, factory floors, and vehicles. Second, the network itself becomes a variable. A latency spike might come from your application, the radio access network, or the last-mile connection, and separating those causes requires instrumentation most teams don’t have out of the box.
Third, the workloads are different. Many edge deployments run inference on live video or sensor streams, where a missed frame matters more than average throughput. Metrics that served cloud teams well often miss the point entirely at the edge.
The Core Latency Metrics That Actually Matter
Latency is the headline number in almost every edge conversation, and for good reason. But “latency” as a single figure is nearly useless. What you need is a distribution.
Percentiles, Not Averages
An average latency of 20 milliseconds sounds fine until you learn that 1% of requests take 400 milliseconds. For a safety-critical application, that tail is the whole story. Track p50, p95, and p99 latency at minimum. The p99 tells you what your worst-served users experience, and at the edge, those users are often the ones whose devices sit on flaky connections.
Where the Time Goes
Break latency into its components: device processing, local network hops, edge node processing, and any backhaul to the cloud. Without this breakdown, you’ll spend weeks optimizing the wrong segment. A common mistake is blaming the edge node when the real culprit is a congested uplink or a chatty protocol that makes ten round trips per request.
Jitter and Consistency
For real-time control systems, consistency often beats raw speed. A robot arm that responds in 8 milliseconds every time is easier to control than one that averages 6 milliseconds but occasionally jumps to 30. Track jitter (the variation in latency) alongside the percentiles.
Throughput, Bandwidth, and Data Reduction
Edge architectures exist partly to avoid shipping every byte to the cloud. That makes data reduction ratio a first-class metric: how much raw data does the edge filter, aggregate, or compress before sending upstream? A video analytics deployment that sends only event clips instead of continuous footage might cut bandwidth by 95% or more, and that number directly drives cost.
Pair it with throughput measured at two points: the ingest rate at the edge node and the egress rate to the cloud. A widening gap between them is an early warning that your filtering logic isn’t keeping up.
Resource and Efficiency Metrics
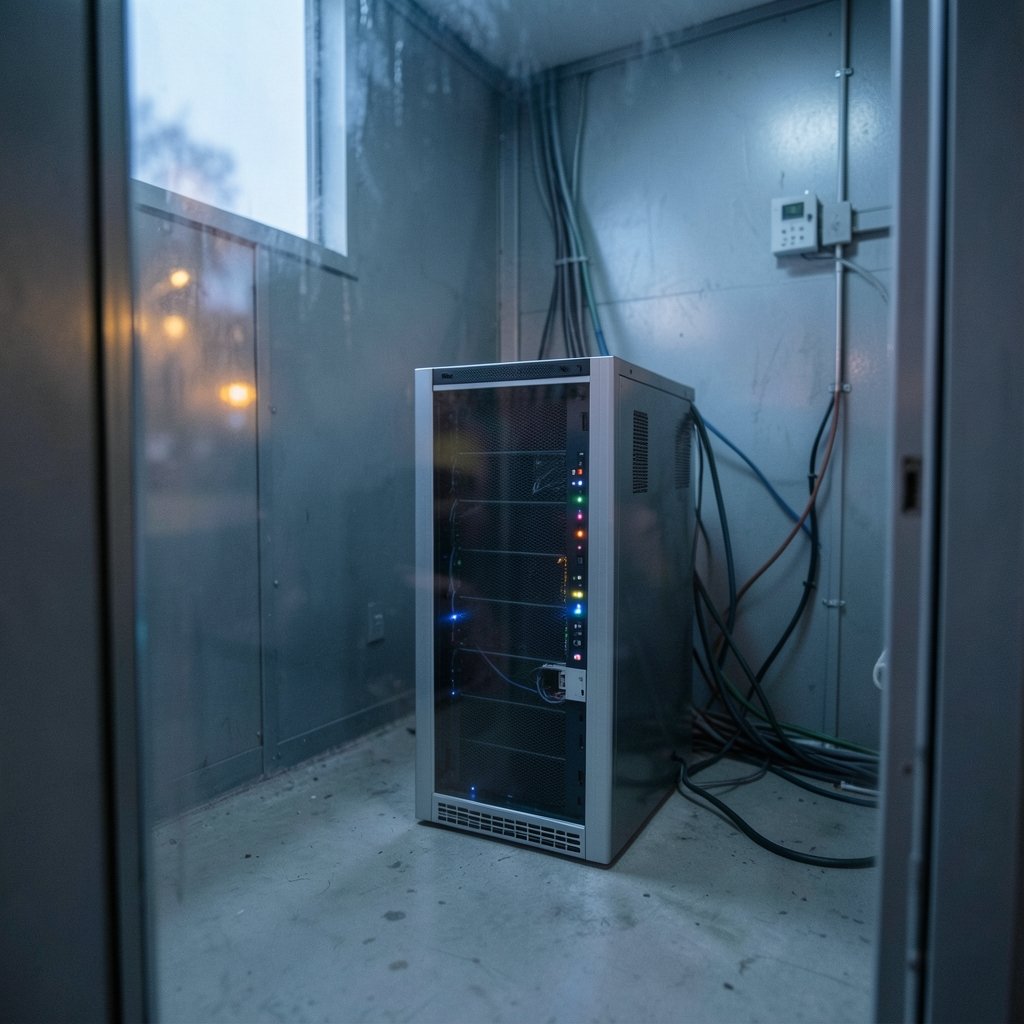
Edge nodes are typically resource-constrained. A server rack in a telco facility has different limits than a fanless box in a warehouse. Watch these closely:
| Metric | Why It Matters at the Edge |
|---|---|
| CPU and accelerator utilization | Overprovisioning wastes money across thousands of sites; underprovisioning causes latency spikes |
| Memory headroom | Edge workloads often spike unpredictably; running near the limit invites crashes |
| Energy per inference | Power and cooling are real constraints in remote or outdoor deployments |
| Cost per workload or per site | The metric executives actually care about |
| Node availability | Uptime across a distributed fleet rather than one data center |
Energy per operation deserves special attention. As more workloads move to devices and small nodes, power budgets become design constraints. This is one reason interest in neuromorphic computing keeps growing: chips designed around event-driven processing can dramatically cut energy per inference for certain workloads.
Reliability and Availability Across a Distributed Fleet
A single data center at 99.99% uptime is a solved problem. Ten thousand edge sites at 99.99% each is a different beast, because failures arrive constantly and individually. Track mean time between failures (MTBF) and mean time to recovery (MTTR) per site class and across the fleet. Fleet-wide averages conceal that one site type, say outdoor cabinets in hot climates, fails far more often than the rest.
Also measure autonomy: how long a node keeps functioning when its uplink drops. Edge systems are supposed to degrade gracefully, and the metric that proves it is the duration of useful local operation during network partitions.
Application-Level and AI-Specific Metrics
If your edge node runs machine learning, infrastructure metrics won’t tell you whether the model is doing its job. Add:
- Inference latency per model, measured on the actual hardware
- Model accuracy drift over time as real-world data shifts
- Frame or sample drop rate for streaming workloads
- False positive and false negative rates where ground truth is available
This connects to a broader trend: as AI moves closer to users, the line between infrastructure and application metrics blurs. Teams exploring what edge AI is and how it works quickly discover that model-level telemetry is not optional; it’s the difference between a system that improves and one that quietly degrades.
How to Instrument an Edge Deployment Without Drowning in Data
The practical challenge is volume. Thousands of nodes emitting detailed telemetry can generate more traffic than the workloads themselves. A few approaches that work in practice:
- Aggregate locally, ship summaries. Compute percentiles and counters at the node, and send rollups upstream on a schedule.
- Sample aggressively for high-cardinality data. Full traces on 1% of requests usually reveal more than shallow metrics on 100%.
- Set alert thresholds on percentiles, not averages. A p99 breach is actionable; an average creeping up by 2% is noise.
- Tag every metric with site, hardware class, and software version. Without these dimensions, you can’t tell whether a regression is geographic, hardware-specific, or a bad rollout.
- Budget for observability overhead. If your monitoring agent consumes 15% of a constrained node’s CPU, you’ve created the problem you’re trying to measure.
A common mistake is instrumenting only the happy path. The most valuable edge metrics often come from failure modes: retries, queue depths, and fallback activations. When a node loses its uplink and switches to local processing, that event should be counted and timed instead of only logged.
Benchmarks and Standards: What Exists and What Doesn’t
Standards bodies have done meaningful work here. ETSI’s Multi-access Edge Computing group published early reference architectures that define where measurement points sit in an edge system, and 3GPP’s specifications for ultra-reliable low-latency communication set targets that edge deployments are often measured against. The IEEE publishes peer-reviewed studies on edge measurement methodology, and the Linux Foundation’s LF Edge umbrella hosts open projects with their own metric conventions.
What’s missing is a universal benchmark. Unlike databases, where standard workloads allow fair comparison, edge deployments vary so widely in hardware, network conditions, and workload shape that cross-study comparisons are shaky. A latency figure without the hardware, model size, network conditions, and percentile attached is close to meaningless. When you read vendor claims, ask for those details. If they can’t provide them, treat the number as marketing.
Common Pitfalls That Skew Edge Metrics
Even well-instrumented teams stumble on predictable issues. Clock skew across distributed nodes corrupts latency calculations; use synchronized time sources and measure durations, not timestamps, where possible. Measurement overhead distorts the system being measured, especially on constrained hardware. Survivorship bias creeps in when failed nodes stop reporting and quietly vanish from dashboards, making the fleet look healthier than it is. And metric proliferation buries the signal: teams that track 200 metrics often act on none of them.
The fix is discipline. Pick a small set of metrics tied to user-visible outcomes, review them on a fixed cadence, and retire anything nobody has looked at in a quarter.
Building a Metrics Strategy That Scales
Start from the outcome and work backward. If the goal is “sub-20-millisecond response for local control,” then p99 latency, jitter, and node availability are your core metrics, and everything else is supporting context. If the goal is “cut cloud bandwidth costs by 80%,” then data reduction ratio and egress volume lead the dashboard.
From there, standardize. Define a metric schema once, enforce it across teams, and version it alongside your deployment tooling. As fleets grow, consistency matters more than sophistication; a simple metric everyone computes the same way beats a clever one computed three different ways. Teams building toward more advanced architectures, whether that’s quantum computing vs classical computing trade-offs or distributed inference, will find that measurement discipline pays off repeatedly. (Multi-access Edge Computing)
Conclusion
Edge computing metrics aren’t a bigger version of cloud monitoring. They’re a different discipline shaped by distribution, constrained hardware, and networks you don’t control. The teams that succeed focus on latency percentiles rather than averages, break response time into its components, measure data reduction and energy per workload, and instrument failure modes as carefully as the happy path. They keep dashboards small and tied to outcomes, and they treat every vendor latency claim with healthy skepticism until the hardware, conditions, and percentiles are on the table. Get those habits right, and the edge stops being a black box. Get them wrong, and you’re optimizing blind across thousands of sites you’ll never visit.
Frequently Asked Questions
What is the single most important edge computing metric?
There’s no universal winner, but p99 latency is the most common starting point because it captures the experience of your worst-served requests, which is often what determines whether a real-time application is usable. Pair it with availability and data reduction ratio to get a balanced picture.
How is edge latency measured differently from cloud latency?
Cloud latency is usually measured between services inside controlled networks. Edge latency must account for device processing, radio and last-mile network conditions, and node processing separately. Because the network segment is variable and often outside your control, breaking latency into components matters far more at the edge.
Why are averages misleading for edge performance?
Averages hide tail behavior. A system averaging 20 milliseconds can still have 1% of requests taking 400 milliseconds, and for safety-critical or real-time workloads, that tail determines whether the application works. Percentiles and jitter reveal the distribution that averages conceal.
What metrics should I track for edge AI workloads?
Track inference latency on the actual target hardware, model accuracy drift over time, frame or sample drop rates, and false positive/negative rates where ground truth exists. Infrastructure metrics alone won’t tell you whether the model is still doing its job as real-world data shifts.
How much telemetry should an edge node send to the cloud?
Enough to answer your key questions, and no more. Aggregate locally into percentiles and counters, sample high-cardinality data aggressively, and ship rollups on a schedule. A useful rule: if the monitoring agent consumes a noticeable share of a constrained node’s CPU, reduce what it collects.
Are there standard benchmarks for comparing edge platforms?
Not in the way databases have standard workloads. Standards bodies define reference architectures and latency targets, and academic studies publish methodologies, but hardware, network conditions, and workload shapes vary so widely that cross-vendor comparisons are unreliable. Always ask for the hardware, model size, network conditions, and percentile behind any latency claim.