
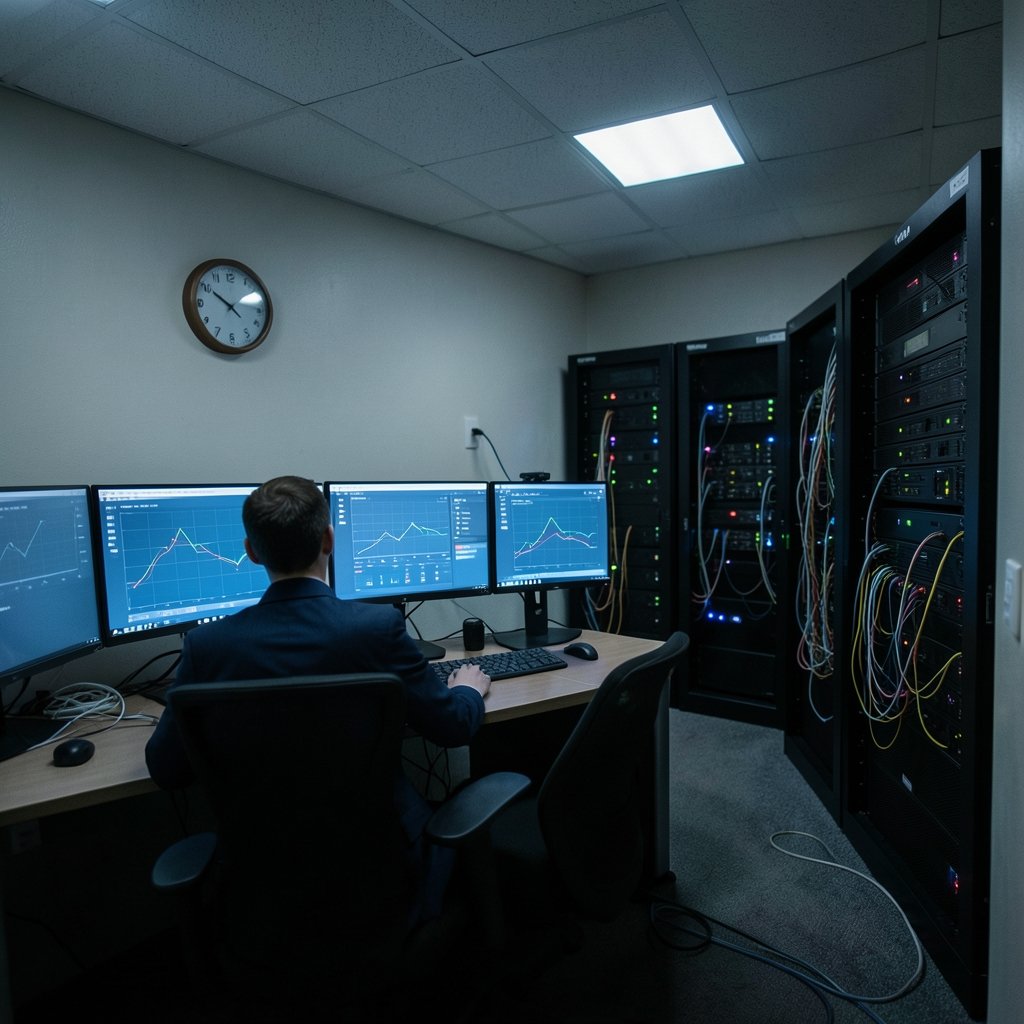
Why does a playbook that worked perfectly in testing suddenly stall at 2 a.m. during a real incident? That question keeps security engineers awake, and it is the heart of security orchestration troubleshooting. Automation looks simple on a diagram: an alert fires, a playbook runs, an analyst gets a clean summary. In production, the same playbook can time out, skip steps, or fail silently because of an expired token, a vendor API change, or a permissions gap nobody noticed.
This article walks through where orchestration breaks, how to diagnose it methodically, and which habits separate teams that trust their automation from teams that babysit it.
What Security Orchestration Troubleshooting Actually Involves
Security orchestration is the layer that connects tools — SIEM, endpoint detection, firewalls, ticketing, identity providers — and runs them in sequence. Troubleshooting it is not the same as debugging application code. You are debugging a chain of third-party services, credentials, network paths, and data formats that all have to line up at the same moment.
That is why most failures are not logic errors in the playbook itself. They are integration and environment problems. A connector authenticates with a credential that rotated last week. A vendor deprecates an API version and responses come back in a new shape. A webhook points at an internal address that a firewall now blocks. The playbook logic is fine; the world around it moved.
The practical takeaway: when a playbook misbehaves, check the edges of the system before you rewrite the middle.
The Most Common Failure Points, Ranked by Frequency

In hands-on practice, failures cluster in a handful of predictable places. The table below maps symptoms to likely causes.
| Symptom | Most likely cause | First check |
|---|---|---|
| Playbook fails at one specific action | Expired or rotated API credential | Integration asset settings |
| Action returns unexpected data | Vendor API version change | Vendor release notes |
| Playbook “runs” but nothing happens | Webhook or callback misconfigured | Callback URL and TLS trust |
| Intermittent timeouts | Rate limits or slow upstream API | Action timeout and retry settings |
| Permission-denied errors | Service account lacks scope | RBAC roles on target system |
| Duplicate actions | Retry logic firing after partial success | Idempotency and retry config |
Integration and Connector Failures
Expired credentials top the list. API keys rotate, OAuth refresh tokens get revoked, and service accounts get disabled when an employee leaves. Each one breaks a playbook quietly until someone notices the automation has been failing for days.
The fix is boring but effective: monitor integration health as its own signal, not as part of incident response. Most orchestration platforms expose a connectivity test or health check per integration. Run those on a schedule and alert when one fails.
Vendors change their APIs. Fields get renamed, endpoints get deprecated, response formats shift. A playbook built against an older version can keep running while producing wrong results — worse than a hard failure, because nobody notices.
Pin integration versions where the platform allows it, read vendor release notes on a schedule, and build a small validation step into critical playbooks that checks for expected fields before acting on data.
Timeouts, Rate Limits, and Retries
Orchestration platforms usually let you set per-action timeouts and retry counts. Teams often leave defaults in place, then wonder why a bulk enrichment step fails when a thousand alerts arrive at once. Rate limits on the target API are the usual culprit.
Good practice: set timeouts deliberately, use exponential backoff, and make retried actions idempotent so a retry does not create duplicate tickets or block the same IP twice.
Webhooks and Callback Misconfiguration
A playbook that “ran but nothing happened” is a classic webhook problem. Wrong URL, expired TLS certificate, or an IP allowlist that no longer includes the orchestrator’s egress address will all produce the same silent result. Verify the callback path end to end with a test event, and log the response code from every outbound call.
RBAC and Permission Mismatches
Permission errors often look like integration failures. The connector authenticates fine, but the service account lacks the scope to isolate a host or close an alert. Audit service account roles whenever a playbook starts failing after an access review or a platform migration.
A Step-by-Step Diagnostic Method
When a playbook fails, work from the outside in. This sequence catches most problems in minutes rather than hours.
- Read the run history first. Open the playbook’s execution log and find the exact action that failed. Do not guess from the alert.
- Check the action-level output. Look at the raw response, not the summarized result. Error codes and messages usually point straight at the cause.
- Test the integration in isolation. Run the connector’s built-in test or a single manual action outside the playbook.
- Verify credentials and scopes. Confirm the credential is current and the service account still holds the required role on the target system.
- Confirm network reachability. Check egress rules, proxy settings, TLS trust, and IP allowlists between the orchestrator and the target.
- Compare against vendor release notes. If the integration worked yesterday, check whether the vendor shipped a change.
- Reproduce with a test event. Replay a sample alert through the playbook in a staging environment before re-enabling it in production.
- Document the fix and add a monitor. Every failure you diagnose should produce a check that catches the next occurrence earlier.
That last step is where most teams fall short. They fix the immediate problem and move on. A week later, the same class of failure returns through a different integration.
Logging and Observability: Where Diagnosis Actually Starts
You cannot troubleshoot what you cannot see. Orchestration platforms typically provide playbook run history, action-level logs, and audit trails. Treat those as your primary diagnostic surface and make sure they are retained long enough to investigate incidents that surface days later.
Three observability habits pay off quickly:
- Log every outbound API call with timestamp, target, status code, and latency.
- Track playbook success rates over time rather than only pass/fail on the last run. A slow decline in success rate signals credential or schema drift before a hard outage.
- Alert on integration health separately from incident alerts, so a broken connector does not hide inside a busy queue.
For teams building broader detection and response programs, pairing orchestration logs with solid endpoint and network telemetry matters. Practical guidance on home security systems and best outdoor security cameras without subscription shows how much visibility depends on the sensors you deploy — the same principle applies to enterprise telemetry.
Common Mistakes Teams Make in Practice
Some patterns show up again and again, and each one is avoidable.
Building playbooks without error branches. Every action can fail. Playbooks that assume success break at the first hiccup. Add explicit failure paths that notify an owner and log context.
Hardcoding values that should be variables. IP ranges, group names, and tenant IDs change. Put them in configuration, not inside the playbook logic.
Skipping staging. Testing against production APIs with live alerts is how you discover problems at the worst moment. Use test tenants and sample events.
Ignoring the human handoff. Automation that escalates without context slows analysts down. Include the alert details, what the playbook already tried, and what the analyst should check next.
Treating automation as set-and-forget. Integrations decay. Schedule quarterly reviews of every active playbook and its dependencies.
Understanding how automation layers coordinate also helps. If your organization runs multiple AI or automation systems, the principles behind what is AI orchestration overlap heavily with security playbook design: clear handoffs, monitored dependencies, and explicit failure handling.
Platform-Specific Troubleshooting: Where to Look
Each orchestration platform documents its own troubleshooting paths, and vendor documentation is the authoritative source for platform-specific behavior. Palo Alto’s Cortex XSOAR documentation covers integration debugging and playbook run inspection. Splunk’s SOAR documentation details app configuration and asset-level error handling. Microsoft Learn covers automation troubleshooting for Sentinel’s Logic Apps connectors. When a failure is platform-specific rather than integration-specific, start there.
For broader context on how automation fits into incident response, the National Institute of Standards and Technology publishes the Computer Security Incident Handling Guide (NIST SP 800-61), which frames detection, analysis, and containment phases that playbooks are meant to support. The guide predates most modern SOAR tooling, but the phase model still holds. (NIST Cybersecurity Framework)
Building Resilience Into Playbooks From the Start
The best troubleshooting is the failure that never reaches production. A few design choices reduce incident load dramatically.
Design for idempotency. Every action should be safe to run twice. That single property eliminates a large share of duplicate-ticket and double-block problems.
Fail loudly. Silent failures are the enemy. If an action cannot complete, the playbook should raise an alert with enough context to act on.
Keep playbooks small and composable. One giant playbook is hard to debug. Smaller playbooks that call each other are easier to test and isolate.
Version control everything. Playbook changes should go through review like code. When something breaks, you can compare against the last known good version.
Assign an owner to every playbook. Unowned automation rots. A named owner means someone notices when success rates drop.
Security teams that also manage physical and personal security infrastructure know this discipline well. The same review habits that keep smart locks for home security reliable — firmware updates, credential rotation, tested failover — apply directly to orchestration integrations.
Conclusion
Security orchestration troubleshooting is less about clever debugging and more about disciplined observation. Most failures trace to credentials, API changes, network paths, or permissions — not to flawed logic. Teams that monitor integration health, log every outbound call, test in staging, and assign ownership to every playbook spend far less time firefighting and far more time trusting their automation.
Start with the run history. Check the edges of the system before rewriting the middle. Then turn every fix into a monitor so the same failure cannot surprise you twice.
Frequently Asked Questions
Why do SOAR playbooks fail in production when they passed testing?
Testing usually runs against stable test data and freshly configured credentials. Production brings rotated keys, rate limits under real load, vendor API changes, and network restrictions that staging never exercises. The playbook logic is rarely the problem; the environment around it is.
How do I debug a playbook that runs but produces no visible result?
Check the callback and webhook configuration first. Confirm the outbound URL is correct, the TLS certificate is trusted, and the orchestrator’s egress IP is allowlisted. Then inspect action-level logs for responses that returned success codes with empty payloads.
What is the fastest way to find which integration broke?
Open the playbook run history and locate the failing action, then run that integration’s built-in connectivity test in isolation. If the test passes outside the playbook but fails inside it, the problem is usually data format or sequencing rather than the connector itself.
How often should orchestration integrations be reviewed?
A quarterly review of active playbooks and their dependencies catches most credential and schema drift. High-value playbooks that run frequently may warrant monthly checks, especially when the connected vendor ships changes often.
Should every playbook have an error-handling branch?
Yes. Every action can fail, and a playbook without failure paths either stops silently or escalates without context. Add explicit failure branches that notify a named owner and log the response details needed to diagnose the issue.
How do rate limits affect orchestration during major incidents?
Incidents generate alert spikes, and bulk enrichment steps can hit target API rate limits quickly. Set deliberate per-action timeouts, use exponential backoff, and batch requests where the platform supports it so a surge does not stall the entire playbook.



